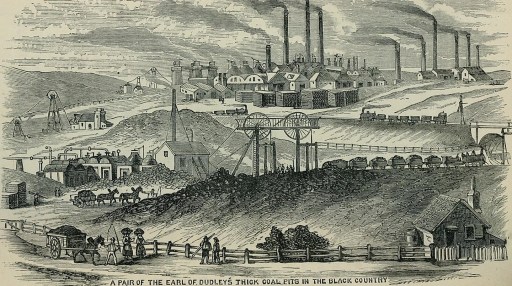
Industrialisation came rather late in the day in the parish of Kingswinford on the western edge of the Black Country (Figure 1). Although there was, in the eighteenth century, a long-established glass industry around the village of Wordsley in the south of the parish, and some shallow coal mining and iron manufacture around Brockmoor and Brierly Hill in the south east, it wasn’t until the first half of the nineteenth century that these grew in scale and spread northwards across the Staffordshire coal fields to utterly change the character of what was a largely rural area around Kingswinford and Pensnett (Figure 2). I have written on this process elsewhere – see here – in particular, in the context of the two Fowler maps of the parish that were produced in 1822 and 1840, which between them graphically illustrate this process of industrialisation.
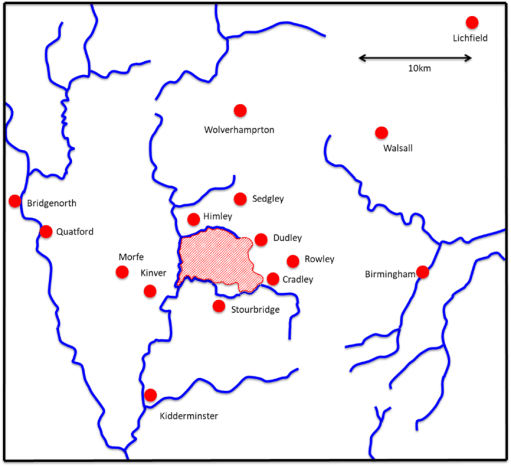
Figure 1. Location of Kingswinford parish
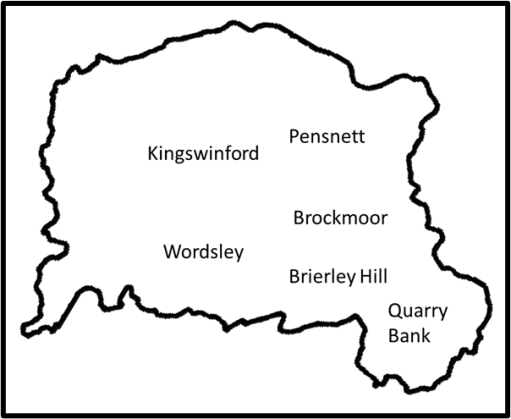
Figure 2 Ecclesiastical Districts within the parish
These developments inevitably led to a major increase in the population of the parish, through migration from surrounding areas and further afield. The census population figures are given in Figure 3, and the growth is population is very apparent. It is the purpose of this short post to investigate where this increase in population came from. I use the data from the 1851 census that has been transcribed into digital form by Ancestry, for all 27,413 entries for the parish, which I copied and pasted page by page from the census returns into an EXCEL spreadsheet in order to carry out the analysis – a lengthy, mind-numbing process and not to be recommended. This included name, area of residence, age and place of birth. This enabled all the entries to be sorted as follows.
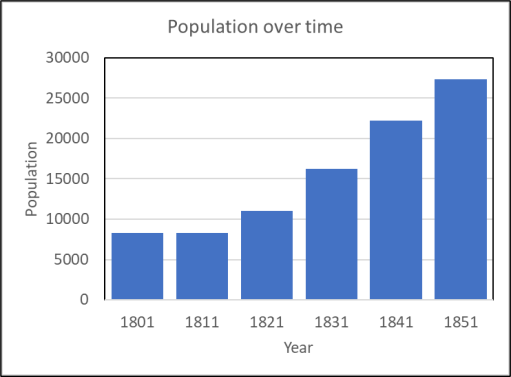
Figure3 Population of Kingswinford parish 1801 to 1851
- By age, and then grouped into 10 and 20 year age bands.
- By residence, in one of the five “Ecclesiastical districts” within the parish that were set up as a precursor to these areas becoming parished in their own right later in the 1850s. Each of these corresponded to a number on census enumeration districts. These were in the old established industrial areas of Wordsley, Brockmoor and Brierly Hill, where there was significant industry in the late eighteenth century; in the areas industrialised between 1820 and 1840 to the north of the parish of Kingswinford village itself (which still retained large rural hinterland) and in the Pensnett area; and in Quarry Bank in the south east, where industrialisation took place in the decade before the census (Figure 2). Residents of the Workhouse in Wordsley was not included in the analysis.
- By birthplace, defined as being within one of five regions – Kingswinford parish itself; the Black Country and Birmingham (the former as defined largely by the modern four Black Country boroughs); Staffordshire (excluding the Black Country regions); Worcestershire (excluding the Black Country regions); Shropshire (excluding the detached portion of Halesowen which was taken as part of the Black Country); and elsewhere – mainly locations in England and Wales, with a very small number from Ireland and Europe). Around 1% of the total population were not allocated a birthplace in the Ancestry transcripts, due to non-legibility of the written entries.
The most populous of the Ecclesiastical districts was that of Brierly Hill with 8800 inhabitants, followed by Pensnett with 4947. The others had populations of around 3000 to 4000 . The breakdown by age decades for the entire parish population is shown in Figure 4, as percentages of the population of each Ecclesiastical district. All areas show similar trends, with around 50% of the population below the age of 20 (which was partly driven by the very large infant mortality). Figure 5 shows the birth locations for the parish as a whole, this time in 20 year (generational) age bands. The majority of the 0 to 19 year band were born within the parish or the surrounding Black Country (85%), but the situation is very different for the other generational bands, with only around 55% of the total being born in Kingswinford parish or the Black Country, with significant numbers being born in the three surrounding counties, particularly Shropshire, and around 10% of the total coming from further afield. This indicates that there had been significant migration, around 20 to 50 years before the census, which is consistent with the overall population growth shown in Figure 3.
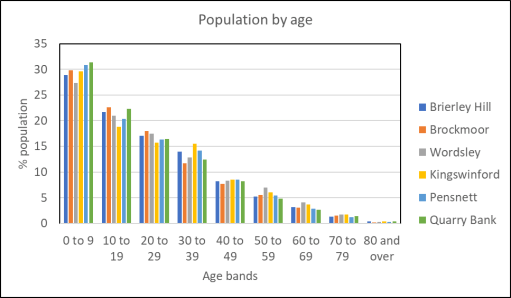
Figure 4. Age breakdown of parish population
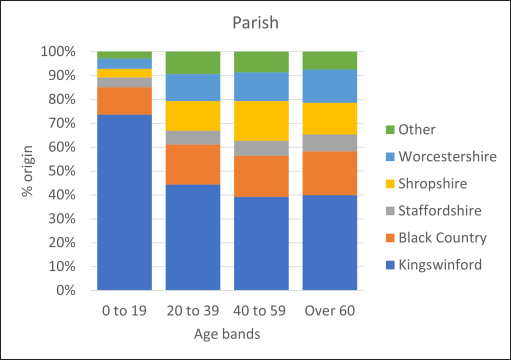
Figure 5. Breakdown of population by age and birthplace
This pattern varied somewhat across the parish, and similar results for each Ecclesiastical district are shown in Figure 6 for the old established industrial regions of Brierley Hill, Wordsley and Brockmoor; for the regions industrialised in the previous 50 years in Kingswinford and Pensnett; and for the Quarry Bank area industrialised over the previous decade. The figures for Brierley Hill, Brockmoor and Wordsley show slightly higher proportions of “local” Kingswinford and Black Country births for the older generations than the parish overall i.e. lower levels of migration. The figures for Kingswinford and Pensnett are very different, with local births for the adult generations below 50%, and only around 30% for the parish births. The proportion of Shropshire births, particularly in the Pensnett data is very large, of the order of 25 to 30%, mainly, as far as can be ascertained form the records, from the Shifnal / Oakengates area. In the newly industrialised Quarry Bank area the pattern is different again with 60 to 70% of local births and the main contributor to the rest coming from Worcestershire (and in particular those areas of the county close to the Black Country).
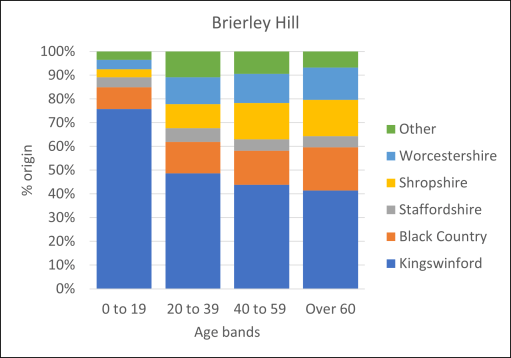
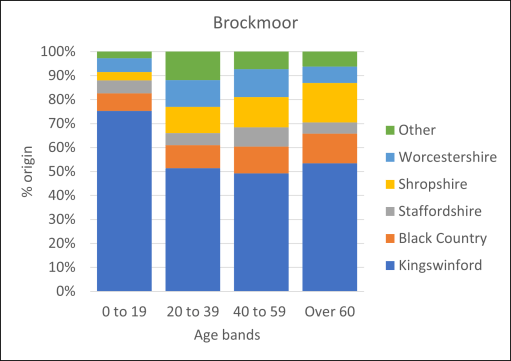
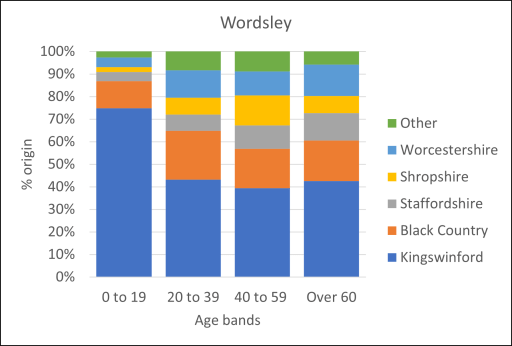
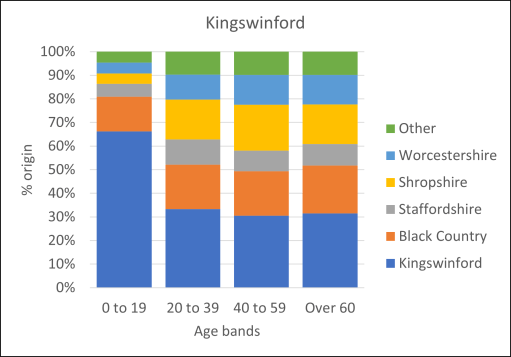

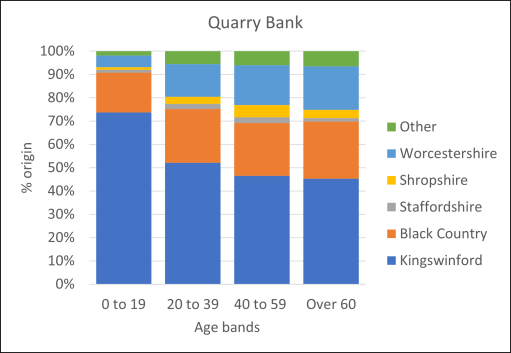
Figure 6. Breakdown of population for each Ecclesiastical district
The levels of migration from Shropshire into the Pensnett / Kingswinford area are of particular interest. It is to my mind likely that such levels would result in significant social tensions, and there is also some evidence of “ghettoisation” (if such a word exists). For example, there was a road in Kingswinford that was named “Shropshire Row” and the Shut End Primitive Methodist church seems to have chiefly served the migrant Shropshire population. This can be illustrated by a spatial analysis of the Pensnett census entries. The occurrence of a Shropshire birth entry was plotted against census entry number for the Pensnett enumeration districts (Figure 7). There can be seen to be regions on the graph that show high density of Shropshire births (around entry 3400, and entries 4000 to 4900). Cross checking against addresses from the census shows that these regions correspond to the new housing estates in the Hollies area, along the Turnpike Road towards Dudley. In these areas the percentage of those with Shropshire births is over 30%. Whilst this analysis is somewhat subjective, it does tend to suggest that a degree of concentration of the Shropshire migrant population did take place.
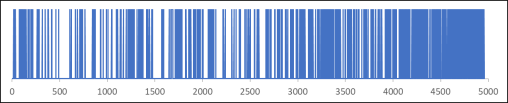
Figure 7. Shropshire births in the Pensnett census entries (vertical line shows register ntry with Shropshire birthplace)
There is one particular migrant group that, though small in number, might well have been quite conspicuous due to language and accent – the Irish. In the 1851 census returns there are 131 entries which register a birth in Ireland. These were mainly concentrated in Brierly Hill (69), Wordsley (35) and Brockmoor (20), i.e. the older industrialised areas, with very few in the Kingswinford, Pensnett and Quarry Bank areas. Of these 36 were under 20, 62 between 20 and 39, 30 between 40 and 59 and only 3 over 60, suggesting perhaps a more recent migration than other groups, mainly over the previous 20 years.
Now the analysis of both the wider parish population and those born in Ireland has not taken into account the Workhouse population, since this was the Poor Law provision for the entire Stourbridge Union, which was larger than the parish. However, in 1851 there were 260 Workhouse entries, 0.95% of the total parish population. 17 of those registered a birthplace in Ireland, 11.5% of the total Irish population – in other words those born in Ireland were significantly over-represented in the Workhouse population.
Finally it is worth noting that much more could be done – particularly in investigating the nature of migrant employment. However there is an issue here in that the census employment details have not been transcribed into digital form, and would need to be transcribed by hand from the original forms (some 30 or 40% of the total number of register entries). This would be an even more time consuming and mind numbing occupation than the one undertaken to date to get the data on which this blog is based. Maybe I will get round to this when I want for something to do. Then again, maybe I won’t.

Fascinating read. I was born and raised in the Wordsley and Kingswinford area with my family coming from Brockmoor and Quarry bank and a few years ago I moved to Telford and was surprised to discover in some of the the old industrial towns of Shropshire such as Dawley used much of the old black country dialect and pronunciations that i heard growing up. I was trying to find out why this was. Your article explains it must of been due to the large immigration of Shropshire workers moving to the newly industrialised Kingswinford parish and bringing the speech with them. Thanks
LikeLike