
The paper summarised in this blog, and another on a different topic that was written around the same time, were originally intended to be sent to journals for publication – after five years of retirement I felt able once again to resume my career long warfare with journal editors and referees. However reading the journal author guides quickly made me change my mind, and I decided simply to mount the papers on this website. This has advantages in that doing so is good for my blood pressure and state of mind, and also allows for immediate dissemination of what has been written, but also disadvantages, in that the papers have not been tested by peer review and, as I am possibly the world’s worst proof reader, no doubt have significant numbers of typographical errors. Readers will come to their own views as to whether my approach has been the correct one.
Note – May 3rd 2024. A much revised version of the paper has been uploaded, with geo-referenced figures with OS grid co-ordinates and extended discussions. The blog below has also been mildly revised.
Outline
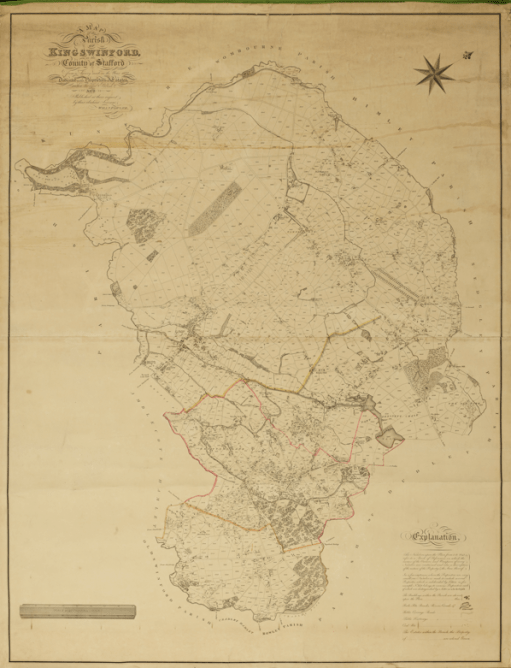
Figure 1. The 1822 Fowler Map
In 1822, the landowners of Kingswinford parish commissioned a map by the firm of William Fowler, a Birmingham firm of land surveyors, that delineated all the properties in the parish, and provided information in a book of reference. This produced a large map at a scale of 1:7920 that is almost a work of art in its own right (figure 1). Note that the map is oriented such that north is in the top right hand corner. The exercise was repeated, probably driven by the Tithe Act of 1835, in 1840. This post links to a technical and analytical paper that investigates what these maps can tell us about the development of the parish over the period between 1822 and 1840 and summarises the findings. Full details are of course given in the paper itself.
The basic approach taken was firstly to transcribe all the entries in the book of reference into searchable spreadsheets – a laborious task that was nonetheless ultimately profitable, and secondly to produce small scale maps with national grid co-ordinates that show the development of specific industries or community functions across the parish. Examples of these are given in what follows.
Firstly Table 1 shows the major proprietors in 1822, which shows the dominant position held by the Dudley Estate.
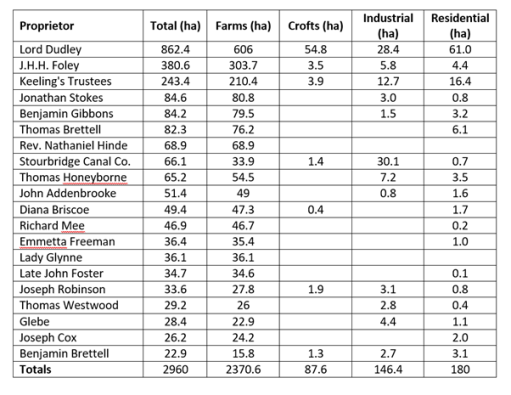
Table 1. Major proprietors in 1822
Figure 2 shows the development of transport links across the parish – and in particular the building of the Stourbridge Extension Canal and the Kingswinford Railway, with associated tramways. The maps here have north to the top in the conventional way.
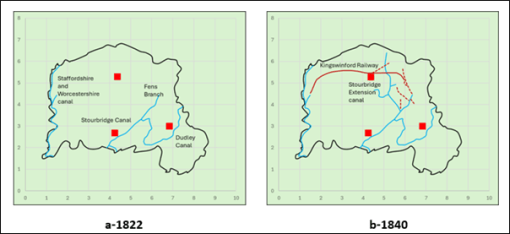
Figure 2 Railways, canals and tramways in 1822 and 1840
Figure 3 shows how coal mining spread across the parish between 1822 and 1840 – from the south to the north; and Figure 4 shows the consequent spread of disused mines.
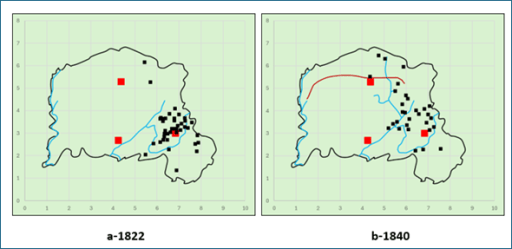
Figure 3 Distribution of coal pits
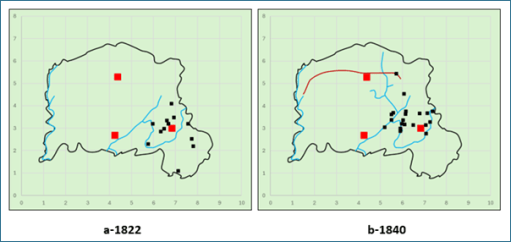
Figure 4 Distribution of Old Colliery Land and Spoil
Figure 5 shows the increase in housing density across the parish and Figure 6 shows the increase in the number of places of worship across the parish, for both the established and non-conformist churches.
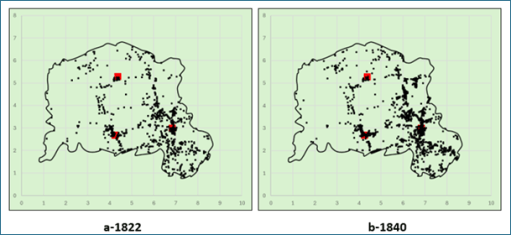
Figure 5. Housing
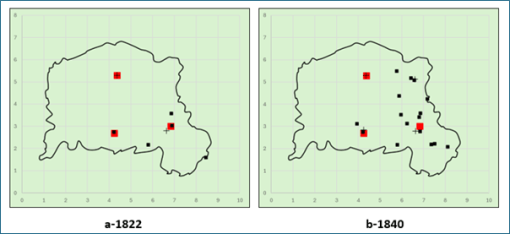
Figure 6 Churches and Chapels
Crosses are Anglican churches or chapels and black squares are non-conformist meeting houses.
The above examples are of course only illustrations of what is a rather complex analysis, which shows that there was a significant development of industry in the northern half of the parish, followed by domestic, commercial and community developments. This was facilitated by the development of canals and railways, and was driven by the major landowners and industrialists, but was enthusiastically followed by very many others.

im looking to buy a full scale copy and the reference book is this possible. Is their a better quality picture life yours available. And may I say once again your work is as impressive as it is interesting and I am forever in your debt, for what you have taught me.
Jamie BCHH
LikeLike
I have both the 1822 and 1840 Fowler maps of course. The problem is that they are copyright – the former to Staffs Record Office and the latter to Dudley Archives, so I can’t supply them to anyone else. All I can suggest is that you contact them directly. Chris
LikeLike