This post is based on a talk given by the author at the PWI Midland Technical Seminar – High Speed Rail: The Technical Challenges, on October 19th2017.
Introduction
When the word “aerodynamics” is used within a railway context, most listeners would immediately think of trains with streamlined front ends whose function is to reduce aerodynamic resistance and thus fuel consumption. This indeed is an important issue for train manufacturers and operators, and, since train aerodynamic resistance varies with (train speed)2, has become of increasing importance in recent years as train speeds increase. However the most aerodynamic effects on the railway are not simply concerned with train design and operation, but are of significant importance to the railway infrastructure as well. These effects include the pressure waves that pass up and down tunnels and affect passengers aural comfort; the sonic booms that are emitted from the end of tunnels on high speed lines; the transient pressures that load trackside structures as trains pass; the high velocity slipstreams flows that can cause problems to passengers waiting on train platforms; the pickup of ballast beneath high speed trains; and a range of disruptive effects caused by high winds.
In the next section, we will briefly consider the tools that are available to the engineer to investigate aerodynamic effects, and then we will proceed to give brief introductions to the effects outlined above.
The available tools
There are essentially four different tools that can be used to investigate aerodynamic effects on train infrastructure – full scale testing; physical model scale testing; computational fluid dynamics (CFD); and the use of codes and standards. We will consider each of these in turn.
Clearly full scale measurements are the preferred type of testing, as these, properly conducted, will actually measure the reality of the situation. There are well established techniques for measuring wind velocities (using a range of anemometers of different types) and pressures (loads) on the infrastructure or the train (using pressure probes and pressure transducers) – see figure 1 for some slipstreams measurements made by BCRRE staff in Germany. However, there are serious practical issues. Setting up measurements requires close liaison with operators, development of safe working practices, possessions to install equipment etc., all of which can be costly and difficult to organize. Full scale tests are very vulnerable to weather conditions, and high winds, which unfortunately tend to come at the most inconvenient time, can make any test results very hard to interpret. To obtain representative data, usually around 20 passes of trains are required, with trains of the same configuration running at close to the same speed, which is of course not always achievable. And of course, very often, information is required for trains or structures that are not yet built, and so full scale testing is not possible. This technique remains the best to use, but these practical issues can often make it impossible to do so.
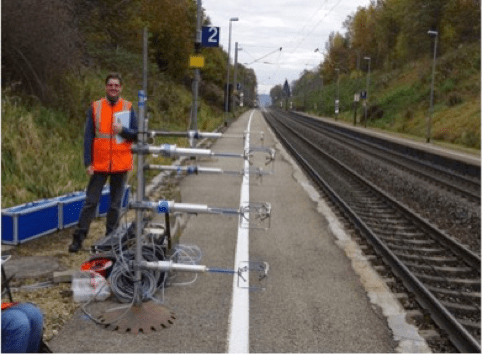
Figure 1 Slipstream measurements in Germany
Physical model tests can take a variety of forms. The simplest (used to investigate cross wind effects) are standard low turbulence wind tunnel tests. However such tests do not properly reproduce the relative motion between the train and the ground. To model these effects properly it is necessary to use a moving model rig, such as the BCRRE TRAIN Rig based at Derby, which is a 150m long test track, capable of firing 1/25thscale model trains along two tracks at 75m/s (270 km/hr) – see figure 2 below. Such rigs can also be used to measure tunnel pressure transients (the TRAIN rig was originally built by BR Research in the 1980s to investigate transients in the proposed Channel Tunnel); loads on trackside structures; slipstream effects and (most recently) for the measurement of flow beneath trains in ballast pickup studies.
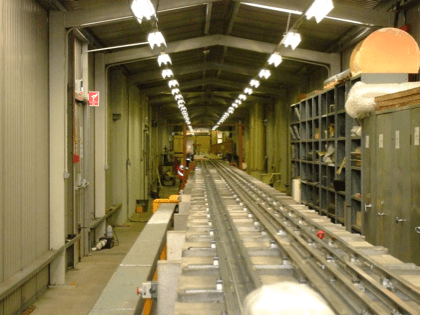
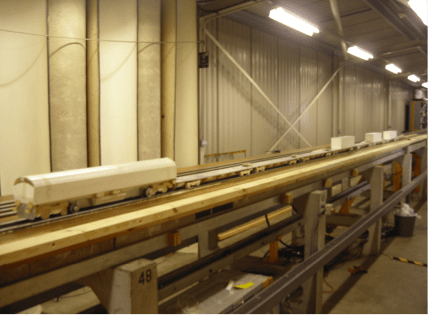
Figure 2 The BCRRE TRAIN Rig
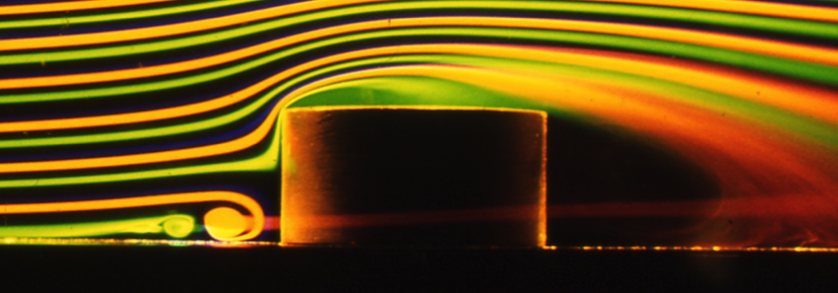
CFD techniques have seen major advances in recent years, and there have been a large number of applications to investigate railway aerodynamic effects. Most investigators use steady flow methods (usually referred to as RANS – Reynolds Average Navier Stokes – methods), which can be run on desktop workstations with run times of the order of hours or a few days. These methods can be learnt quite easily, and can give an indication of the flow field around trains and railway infrastructure. Whilst they are undoubtedly convenient, they do have significant limitations in that they cannot fully describe the highly transient an unsteady aerodynamic conditions that exist in the railway environment. Thus in recent years unsteady methods such as Detached Eddy Simulation (DES) and Large Eddy Simulation (LES) have come to be used more and more. Whilst these methods can produce a great deal of flow field and loading information (see figure 3 below for exapmle), they are extremely resource intensive. For example recent calculations at Birmingham to measure cross wind effects on trains have used computational grids with more than 50 million cells, which take weeks or months to run on the University supercomputer facility. Such methods are not yet practical for routine use in the train and infrastructure design, although they may well become so in the not too distant future.
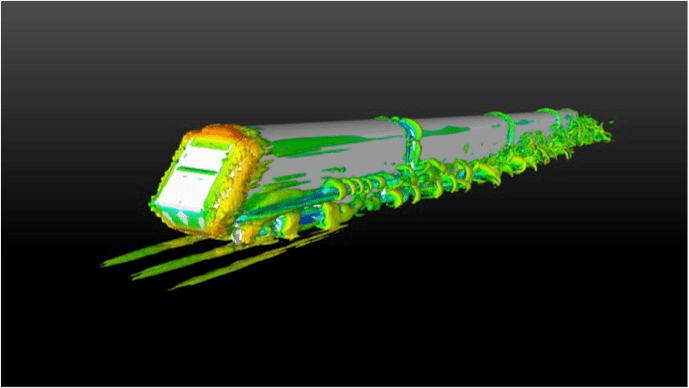
Figure 3 DES Simulation of the flow field around a Class 43 HST
Finally we come to codes and standards. In recent years much work has been undertaken by CEN to produce a series of standards entitled “Railway Applications – Aerodynamics EN14067”. There are six parts to this code – Part 1 Symbols and Units; Part 2 Aerodynamics on the Open Track; Part 3 Aerodynamics in tunnels; Part 4 Requirements and test procedures for aerodynamics on open track; Part 5 Requirements and test procedures for aerodynamics in tunnels; Part 6 Requirements and test procedures for cross wind assessment. These standards have aimed to synthesise a great deal of work that has been carried out over recent years, and provide a very valuable resource. At the time of writing revisions are underway on parts 4 to 6, and a further standard on ballast pickup assessment is in the very early stage of development. Various aerodynamic requirements are also set out in the Infrastructure and Rolling Stock TSIs, often referring back to the CEN standards for the methodology.
Tunnel pressure waves and sonic booms
The phenomenon of pressure changes in tunnels is well known. Essentially when a train enters a tunnel a compression wave (pressure increase) passes along the tunnel at the speed of sound. This reflects from the open end of the tunnel as an expansion wave (pressure decrease) and travels back along the tunnel. To complicate matters when the end of the train enters the tunnel this generates and expansion wave which again passes along the tunnel but reflects as a compression wave. These pressure waves can thus bounce from one end of the tunnel to another, resulting in extremely complicated pressure patterns both in the tunnel and on the train itself. The complexity can be compounded by the presence of airshafts which can also cause wave reflections, or by more than one train in the tunnel at the time. On unsealed trains this variable pressure can be very uncomfortable for passengers, and there are some tunnels on the GB network where aerodynamic speed limits are in operation. Most modern trains are sealed of course, and depending on the degree of sealing the pressure transients may or may not be felt by passengers. The CEN codes specify criteria for allowable pressure changes over different periods of time – for example 3kPa in 4 seconds in a single track tunnel. These transients can be quite accurately predicted using very simple one dimensional calculation methods, based on the equations of gas dynamics, and more complex CFD methods are only necessary for very detailed calculations around, say, the inlet to the tunnel. The advantage of the simple methods is that they can be run a large number of times to investigate a wide range of cases i.e. when trains enter the tunnels from both ends, the time lag between the first and the second entering the tunnel can be varied to investigate the worst case scenario.
An associated issue is that of the sonic booms that are emitted form the ends of tunnels on high-speed lines. This was first noticed in Japan in the 1980s as Shinkansen speeds increased through relatively small tunnels. Once observed, its cause was quite quickly established. The compression wave that results from train entry into the tunnel is not an instantaneous pressure rise, but rather a more gradual rise over a short period of time. The pressure wave thus has a spatial gradient. For long tunnels, particularly with ballasted track, the friction of the tunnel wall and track bed tends to steepen the wave significantly. When this wave arrives at the far end of the tunnel, most of the energy is reflected as an expansion wave, but some of the energy propagates outward as a sonic boom, with an intensity that is proportional to the pressure gradient at the exit. The method for minimizing sonic booms is straightforward, although perhaps not intuitive, and involves giving the inlet pressure wave as shallow a gradient as possible, so that even if it does steepen in the tunnel, its gradient at the outlet is still not sufficiently large to cause a strong sonic boom. This is achieved by the use of variable area hoods at the entrance to the tunnel – see figure 4 below for a hood that was tested on the TRAIN Rig at Birmingham as part of the initial HS2 studies.
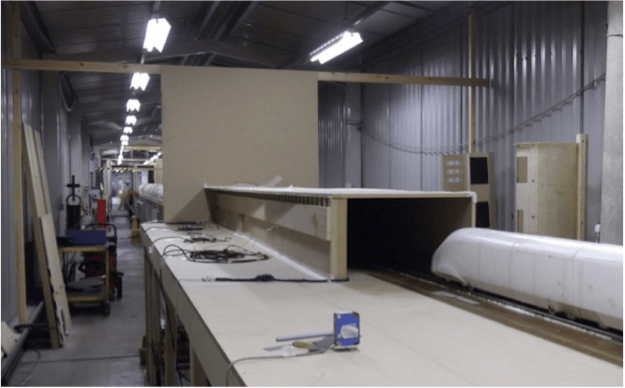
Figure 4 Tunnel entrance hood to eliminate sonic booms
Aerodynamic loading of trackside structures
As the front of trains pass by trackside structures, they generate a transient pressure wave on the structure with the pressures first increasing and then decreasing. For example figure 5 shows the pressure on the underside of an overbridge as three different trains pass, plotted in dimensionless terms as a pressure coefficient. The peak to peak pressures are not in general that large (around 0.5 to 1kPa in dimensional terms) but, when they are repeated many thousands of times, can lead to fatigue failure of structures such as noise barriers, platform canopies etc. Guidance on allowing for these effects can be found in the CEN codes, based on full-scale tests carried out in Germany in the 1980s. These are of course not directly applicable to the GB situation because of the different loading gauge, so the RSSB have recently commissioned some tests on the TRAIN rig to measure the pressure transients on a variety of structures (hoardings, canopies, overbridges, tressle platforms) using 1/25thscale models, to provide information for a UK National Annex. The data shown in figure 5 is taken from those experiments and shows that the pressure transients caused by a Class 66 locomotive is very much greater than that caused by a Class 158 multiple Unit or the Class 390 Pendolino.
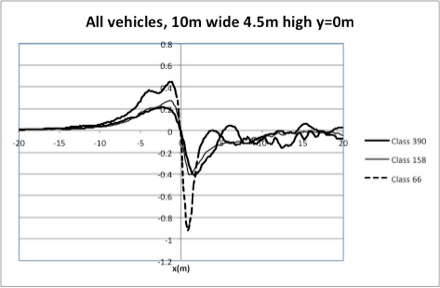
Figure 5 Pressure transients measured on a 10m wide bridge, 4.5 m above the track in TRAIN Rig experiments
Train slipstreams
As trains move along the track, not only do they generate pressure transients as outlined above, but they also generate high velocities. This velocity field is known colloquially as a slipstream. Along the side of the train (and on the roof) there is a region of flow where the air around the train is moving at the train speed next to the surface of the train (due to friction effects), decaying to zero at some distance away from the train. This region is known as the train boundary layer, and its thickness grows along the train. For passenger trains the boundary layer can be around 1m to 1.5 thick at the end of the train. For freight trains the boundary layer can be much thicker and extend 3 or 4m from the side of the train. In the wake of the train, the flow is very different for passenger and freight trains. For passenger trains the flow within the boundary layer rolls up into longitudinal vortex structures that can extend for tens or hundreds of metres behind the train – and indeed for such trains the highest airflow velocities are usually found in the wake and experienced by passengers on platforms when the train is disappearing into the distance. For freight trains these vortices do not seem to exist, and the flow velocities decay rapidly behind the train. This difference in the flow field is illustrated in figure 6, which shows the average velocities measured at trackside for around 20 train passes, as an ICE2 and a container freight train pass by. It can be seen that the highest velocities for the ICE2 occur in the wake of the train, but for the freight train these occur along the side of the train and the high velocities exists for much longer than for passenger trains. In this figure the air velocities are normalized by train speed, and the normalized freight train air velocities are much higher than those for the passenger train. This implies that the air flow velocities caused by freight trains at their normal operating speed (80 to 100km/h) can be higher than those caused by passenger trains moving much faster. This issue has come to prominence lately because of two incidents in the UK. In the first, at Twyford station, a disabled girl in a pushchair was sucked into the side of a hopper train, and, mercifully, simply bounced of with only a minor injury. In the second an empty pushchair was moved by the slipstream of a passing container train at Nuneaton station and hit the train before bouncing back onto the platform. There is potentially an issue here that needs to be addressed by the industry.
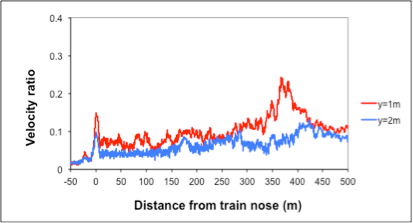
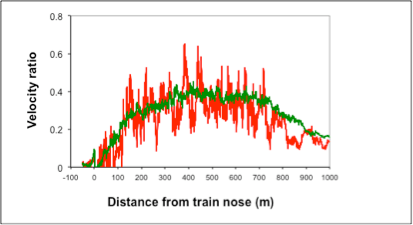
Figure 6. Slipstream velocities measured for a high speed passenger train (ICE2) and a container freight train. (passenger train figure shows velocities at different distances from the side of the 270m long train; container train figure shows velocities for two different container consists for a 600m long train)
As noted above, train slipstream velocities can be measured at full scale, with all the practical difficulties that involves. A methodology is given in the CEN standards, together with limits for allowable velocities at both trackside and on platforms. Over recent years, it has been demonstrated that moving model tests an also be used for slipstream velocity measurements, although careful consideration of scaling effects is required. Standard RANS CFD techniques are not yet suitable for slipstream velocity assessments, because they do not capture the highly transient nature of the flow.
Ballast pickup
The problem of ballast flight beneath trains is one that has made itself felt very forcibly over recent years, with a variety of (usually unpublicised and unpublished) events occurring on high speed lines, where ballast has been lifted from the track, seemingly by aerodynamic effects, and caused considerable damage to train under bodies and tracks. The phenomenon seems to manifest itself in different ways in different countries. In parts of Europe incidents have occurred in normal weather conditions, where large quantities of quite large ballast have become airborne and caused extensive pitting of train under bodies. In particular this occurred during ICE3 tests in French and Belgium lines in 2003 and 2004, where major damage was caused to the trains, but other incidents have been reported in Italy and Spain. In other parts of France and the Far East, the problem seems to be due to ice particles falling from trains, that then displace ballast that then causes train and track damage. In the UK, the problem appears to be due to smaller ballast particles being lifted onto the track, where they are crushed by either the train that caused the ballast to lift or a following train, leading to pitting of the wheel and rail, and the need for more regular maintenance and shown below. Indeed discussion with operators in the UK suggest that the flight of ballast has been a problem for many years, with long term requirements for extra wheel maintenance through grinding, for the front and rear wheel sets, and regular observations of ballast high up in the underbody equipment during maintenance periods. But without a doubt the most severe issues occur on ballasted high-speed lines when operating around and above 300km/hr.
The causes of ballast pickup are quite complex. Ballast experiences a number of different types of force as trains pass over – mechanical forces due to track vibration and aerodynamic pressure and friction forces. These forces all vary in different ways with train geometry speed, ballast size and packing etc., and these variations probably explain the different ways in which the phenomenon is manifested. This phenomenon has initiated a significant amount of research work around the world, particularly within Europe, through the Aerodynamics in the Open Air (AOA) and AeroTRAIN projects. The thrust of these investigations has been towards developing a method for the certification of new trains, through a standardised testing procedure, based on measuring the flow velocity beneath trains above a standardised track form. More recent tests by the University of Birmingham and the University of Southampton on HS1 have measured mechanical effects and aerodynamic effects simultaneously during the passage of Eurostars in an attempt to understand more fully the physics behind ballast pick up. Southampton University developed the technique of using ballast with accelerometers, data loggers and batteries mounted within the ballast itself – with the data downloaded each evening via a USB port! Alongside these full scale tests, work was carried out to predict the flow beneath the train using physical models on the TRAIN Rig and advanced CFD techniques. The Eurostar model on the TRAIN Rig is shown in Figure 7. It can be seen that the train travelled along the rig upside down under a false floor, to make access easier for instruments. The physical model experiments were in excellent agreement with full-scale results and potentially offer a way for the certification of new train designs, although much further development work is required.
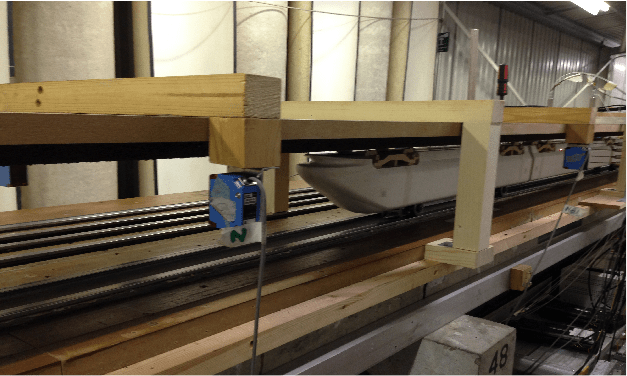
Figure 7 Upside down Eurostar model on the TRAIN Rig for underbody flow measurements
High wind effects
The study of the effects of high winds on trains has a long history dating back to the risk assessment that was carried out to determine the risk of the Advanced Passenger Train blowing over on the West Coast Main Line in the late 1970s. The Rolling Stock TSI specifies that all new high speed trains have to demonstrate that they have sufficient cross wind stability (i.e. they will not overturn) and likewise the Infrastructure TSI requires that a suitable risk assessment is carried out before trains can be certified to run on specific routes. The methods for carrying out these assessments are quite complex and are set out in the TSIs and CEN standards. The risk assessment requires the exposure of routes to high winds to be assessed, and the risks of high wind gusts to be specified.
However the effect of cross winds on railway operation is not of course confined to train design and route risk assessment. In the recent storms in Europe (early 2018), the German and Dutch railway authorities simply stopped train movement, because of worries about debris on the track or trees falling onto overhead wires – not because of worries about trains overturning, as the wind speeds were much too low for that. The same happens in the UK. When high winds are forecast Network Rail and the TOCs first impose a blanket regional 50mph speed limit, mainly so that trains have some hope of reducing speed when debris is blown onto the track. A major problem in this regard seems to be trampolines at the moment (!) and at higher predicted gust speeds of around 65mph, train operation is stopped completely. Also, very often, train movements are blocked by tree fall onto the overhead.
Closing comments
It can be seen from the descriptions of the various issues set out above that there are a wide range of aerodynamic issues that need to be taken into account in railway infrastructure design and operation, as well as in the design of new trains and other rolling stock. One final point is worthy of mention however. It seems to the author that this range of issues is ill served by a simple split between train effects and infrastructure effects, as is, inevitably, fostered by the Rolling Stock and Infrastructure TSI. Aerodynamic effects on the railway are usually a combination of the effects of train movement around and through infrastructure – trackside structures, the track itself, tunnels and so on, and cannot easily be compartmentalized. This is perhaps what makes the subject such a fascinating one for study!
