The experiments described in this post involved a large number of colleagues in the development and mounting of instrumentation, the sorting of the data and the analysis and interpretation of the results. Dr Andrew Quinn, Dr Dave Soper, Dr Martin Gallagher and Dr Stefanie Gillmeier of the University of Birmingham, and Mr Terry Johnson of RSSB deserve special mention. The assistance of staff at Network Rail who operated the New Measurement Train is also gratefully acknowledged.
In the previous post I discussed the pressure transients measured on the NMT due to passing trains on the WCML. In this post, I will consider the pressure transients that were measured as the NMT passed through a number of tunnels on that route. These transients can be the source of significant aural discomfort for passengers. The five tunnels that are considered are outlined in Table 1 below. They are arranged in order of length, from the shortest Preston Brook at 71m to the longest, Kilsby, at 2.2km. All are double track tunnels that cater for either fast trains only, or for mixed traffic. They were all built in the 1840s when the line was constructed and are small by today’s standards. Two of them have airshafts.
The pressures that will be presented were measured on the side of the train, although pressure varied little around the circumference in most cases. They were measured against a reference pressure in a leaky reservoir on the train itself, and a small correction was required to relate them to atmospheric pressure. The main unknown was the actual configuration of the NMT at the time the measurements were made. The NMT could run as two power cars plus anything between 3 and 5 coaches between them, giving train lengths of 115m to 161m. The pressure measurement points were 14m from the end of the power car. Also, as these were operational runs, the train speed could vary by several m/s during any one run. Thus the velocities that are given below must only be regarded indicative.

Table 1 Tunnel characteristics
We begin by considering the shortest tunnel – Preston Brook at 71m. Figure 1 shows the pressure transients measured on the NMT for the front car and the rear car, at similar speeds. Both pressure records were obtained from runs in the down (London to Glasgow) direction, as indeed is the case for all the results described below. Consider first the case of the front car. The nose of the train enters the tunnel around 0.3s earlier than the measuring point (distance from nose / train speed) and sets up a compression (positive pressure) wave. This takes approximately 0.2s to travel along the tunnel (tunnel length / speed of sound) and then reflects as an expansion (negative pressure) wave, taking another 0.2s to reach the initial end. Thus the measurement point experiences a short period of positive pressure for about 0.1s, before the expansion wave passes over it causing a dramatic fall in pressure. The pressure then oscillates with a period of around 0.4s to 0.5s as the wave passes back and forth along the tunnel. The measurement point leaves the tunnel before the rear of the train enters.
The situation is somewhat different when the measurements are made at the rear of the train. By the time the measurement point enters the tunnel the initial wave system caused by the train nose will have traversed the tunnel four or five times, and friction will have attenuated its magnitude significantly. From the pressure data shown, it can be seen that the measurement point experiences a small period of positive pressure, before the expansion wave from the rear of the train passes over it causing a sharp drop in pressure. This tail wave then dominates, reflecting from the far end as a compression wave, with again an overall period of about 0.4s to 0.5s. The data from Preston Brook thus shows the pressure variations due to single waves – either the nose wave or the tail wave.

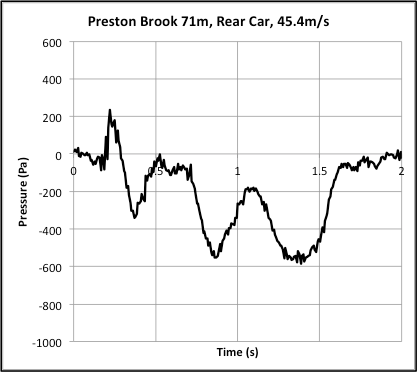
Figure 1 Preston Brook tunnel
Kensall Green tunnel is 290m long, and the train speeds are in general somewhat lower than elsewhere, as trains are accelerating away from Euston. Again, consider the pressures on the leading car first. The front of the train enters the tunnel around 0.25s before the measurement point enters. The nose compression wave will take about 1.8s to travel to the far end of the tunnel and back again. The measurement point first experiences the increase in pressure behind the initial wave, which grows steadily due to wall friction slowing the flow around the train. At around 2s, the expansion wave passes over it and the pressure falls rapidly. This wave reflects back along the tunnel and passes over the measurement point again as an expansion wave at about 3.8s. Now the tail of the train will enter the tunnel somewhere between 3 and 4s after the nose depending on the (unknown) train length. Its effect can be seen from the fact that the regular oscillations up to around 5s are disrupted by interaction between the nose and tail wave systems. For the rear measurement point, the pressure drops initially as the tail expansion wave passes over the measurement point. Thereafter the oscillation pattern is a complex interaction between nose and tail wave systems.
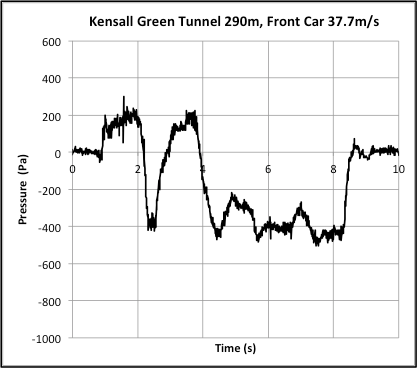

Figure 2 Kensall Green tunnel
Northchurch tunnel (figure 3) is a little longer than Kensall green and the train speeds are somewhat higher. The main difference however is that this tunnel has an airshaft at its mid point. For the front car measurements the nose enters the tunnel at a time of about 1.6s. Although the main nose wave will take around 2s to return to the start of the tunnel at a time of 3.5 to 4s, a smaller reflected wave from the airshaft can be expected to pass over the measurement point before that. This can be seen to be the case, with the pressure at the front measuring point showing a sharp fall as the expansion wave from the airshaft passes over it at a time of around 2.2s. The main expansion wave arrives at about 3.7s. The train tail enters the tunnel two or three seconds after the train nose (depending on the unknown train length) and the resulting expansion wave and its reflections at the airshaft and far end of the tunnel add to the complications. For the rear measurement point, the expansion wave due to the tail passes over it first, and then it is subject to the complex interactions between the reflecting waves. Thus the presence of an airshaft can be seen to considerably complicate the measured pressures.

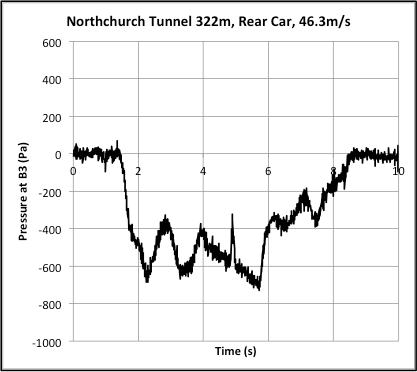
Figure 3 Northchurch tunnel
Shugborough tunnel passes underneath the former Shugborough estate of the Earl of Lichfield, and its portals are suitably grand (see figure 4). More prosaically, Figure 5 shows the pressure traces for the 700m long Shugborough tunnel, which has no air shafts. In some ways this is the simplest of all the traces. The front measurement point shows the initial compression wave and the gradual increase in pressure due to friction. The initial wave takes about 4s to return to the entrance, whilst the tail of the train enters the tunnel between 3 and 4s after the nose and its expansion wave will pass over the measurement point at about the same time as the reflected nose wave. The sharp drop caused by these waves at about 5s is clear. Thereafter the two wave systems can be seen to be broadly in phase and pass backwards and forwards along the tunnel producing complex peaks and troughs of pressure. The rear measurement point experiences an initial fall in pressure due to the tail expansion wave, and thereafter is subject to the pressure distributions of the complex interacting waves.

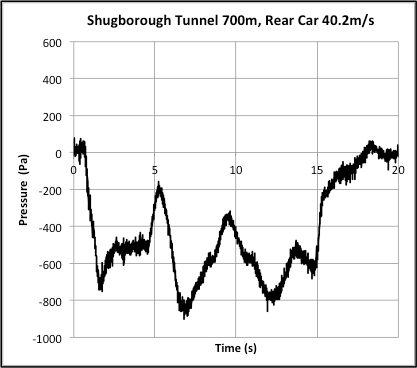
Figure 5 Shugborough tunnel
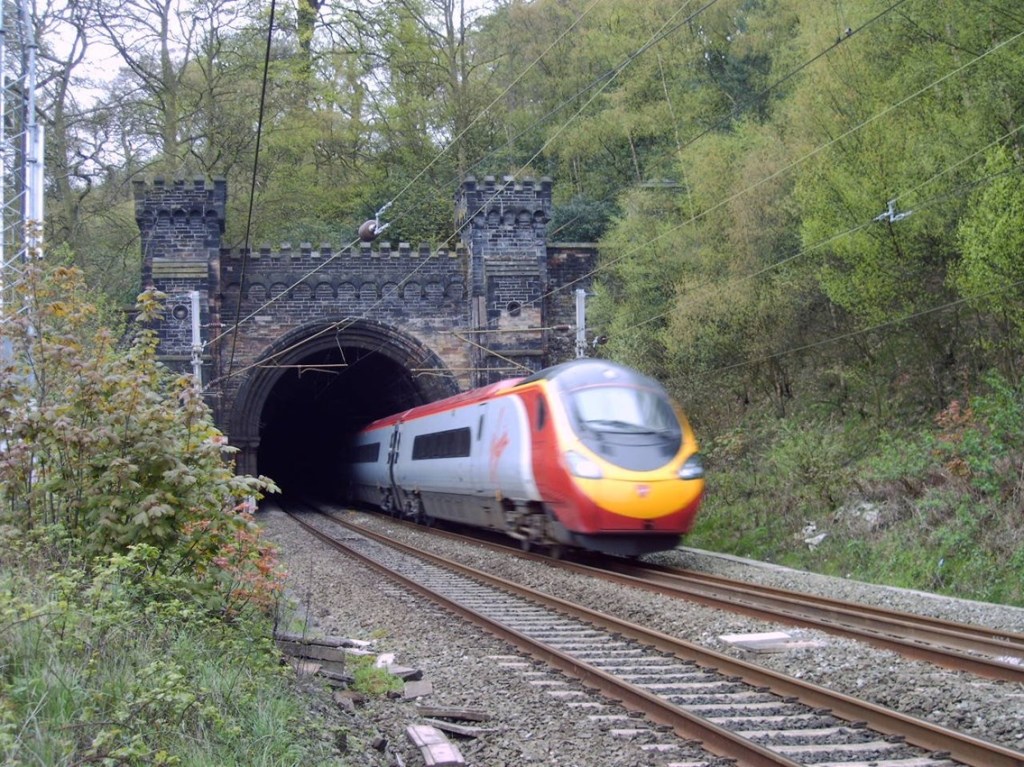
Figure 6 Western portal of Shugborough tunnel
Kilsby tunnel (figure 6) is quite a fascinating construction. When it was built it was the longest tunnel in the world, at 2.225km and has numerous airshafts (table 1). The largest of these, at the 1/3 and 2/3 points are vast, and more like caverns than airshafts. A picture of one of the surface structures for these airshafts is shown in figure 7. In addition there are 10 other open shafts distributed along the tunnel. Recent investigative work by NR has revealed that there are a number of other blind shafts or pumping shafts along the line of the tunnel, and some someway off the line, whose position cannot be precisely determined.
In aerodynamic terms the large airshafts effectively split the tunnel into three, and this is very clear from the pressure records for both the front and rear measurement points in figure 6. Interestingly, the two measurement points on the train may well be in different sections of the tunnel at any one time, and thus subject to completely different pressure wave systems. As with Northchurch the measurements record multiple reflections from the airshafts, and the presence of three or four airshafts in each section results in highly complex flow patterns.
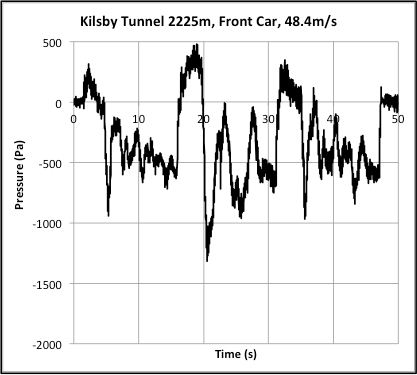

Figure 6 Kilsby tunnel

Figure 7 Kilsby tunnel airshaft
Finally consider the rear car results from Shugborough for a range of train speed (figure 8). The 40.2m/s speed data has already been shown in figure 4 and shows the expected pattern of a steep initial drop due to the passage of the train tail expansion wave and then a series of interacting wave reflections. Similarly the lowest speed 28.2m/s data show the expected pressure wave oscillations. However the mid-speed range 32.3m/s data shows no such oscillations here. It is likely in this case that the initial nose wave returns to the tunnel entrance as the train tale enters and is cancelled out by the tail expansion wave. Such an effect is of course critically dependent upon the precise values of train speed (which are not well specified for these measurements) and tunnel length, but is interesting nonetheless.

Figure 8 Shugborough tunnel pressures for several train speeds.
