The experiments described in this post involved a large number of colleagues in the development and mounting of instrumentation, the sorting of the data and the analysis and interpretation of the results. Dr Andrew Quinn, Dr Dave Soper, Dr Martin Gallagher and Dr Stefanie Gillmeier of the University of Birmingham, and Mr Terry Johnson of RSSB deserve special mention. The assistance of staff at Network Rail who operated the New Measurement Train is also gratefully acknowledged.
Between 2011 and 2016, as part of a large project sponsored by the UK Engineering and Physical Sciences Research Council, colleagues at the University of Birmingham made full-scale aerodynamic measurements on the Network Rail New Measurement Train (NMT). This is a Class 43 train, with two power cars and a variable number of coaches, which is used to assess track conditions on main line railways in the UK (figure 1), on a regular two-week cycle. The aerodynamic measurements were mainly directed at measuring crosswind forces, and these results have been reported elsewhere. However during its travels around the country the NMT also detected the pressure transients caused by other passing trains, and by its own passage through tunnels. Whilst this data is of itself reliable and can be located confidently in time and space, it is not always easy to get the precise experimental conditions associated with each set of pressure transients – for example the precise NMT configuration in terms of number of coaches; the wind conditions; type and speed of passing trains etc.. Thus these results are not fully adequate for publication. Nonetheless they are of some interest if properly interpreted, and thus this blog post will present some of these results for open-air pressure transients, and the next will present some results for tunnel transients. The former are important as pressure transients caused by passing trains can cause trains to be suddenly displaced laterally causing passenger discomfort, and can also cause repeated loading on trains and trackside infrastructure, which can contribute to fatigue failure of components or structures. Tunnel pressure transients can be a source of aural discomfort to passengers, particularly in narrow tunnels – and indeed there are locations in the UK where aerodynamic speed limits have been imposed on tunnels.
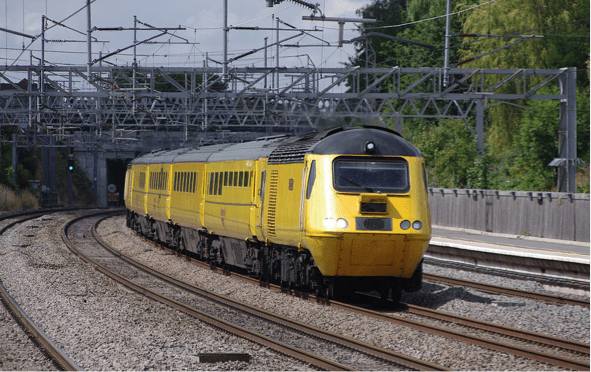
Figure 1. The New Measurement Train
The results that will be presented were all obtained as the NMT passed up and down the West Coast Main Line between London and Glasgow. This is a 200km/h line, with both four-track sections (two for fast trains and two for slow trains) and two-track sections. It has branches to Birmingham, Manchester and Liverpool. In the four-track sections the NMT always travelled on the fast lines. The services that use the line are as follows.
- 200 km/h services with limited stops between London, Birmingham, Liverpool, Manchester and Glasgow, using 9 or 11 car Class 390 Pendolino tilting trains (figure 2a)
- 200 km/h services that connect a range of towns and cities across the country using double unit Class 220 4 car Voyager trains (non-tilting) or Class 221 4 or 5 car Super Voyagers (tilting) (figure 2b), in 8 or 9 car formation. Irregular 4 or 5 coach Class 220/221 units also operate over sections of the WCML route.
- Semi-fast and commuter services operated mainly by Class 319 trains (figure 2c) south of Milton Keynes and by Class 350 trains along the whole line (figure 2d). Both of these run in single (4 car) unit or double (8 car) unit configurations. Class 350s can travel at 175 km/h and Class 319s at 160km/h.
- A variety of freight services hauled by both electric and diesel locomotives. Perhaps the most common locomotive in use is the Class 66 (figure 2e)

(a) Class 390 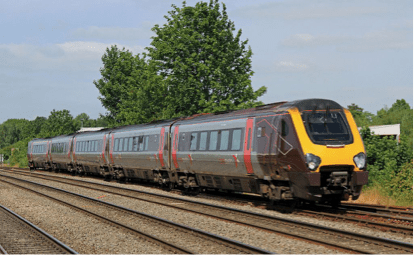
(b) Class 221 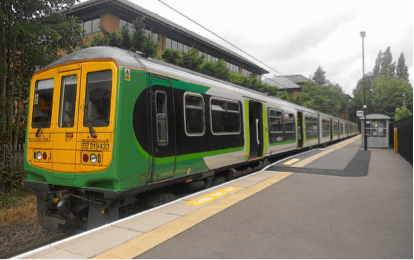
(c) Class 319 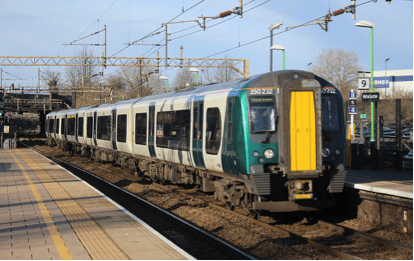
(d) Class 350 
(e) Class 66 locomotive
Figure 2 Train types on the WCML
Typical pressure transients measured on the side of the NMT for Class 390s, Class 221s, Class 350s and freight trains are shown in figure 3. It can be seen that
- all types of train show a large positive / negative pressure transient as the nose of the passing train passes the measuring point and the passenger trains also show a negative / positive tail peak;
- no tail peak can be observed for freight trains;
- a large transient can be observed at the gap in the centre of the double unit trains;
- between the peaks there is a small negative pressure, and the passage of individual carriages can also be discerned on the pressure traces.
The time between the nose and tail transients can be used to determine the speed of the oncoming train, if the type of train and its length can confidently be specified. This was in general only the case for the Class 390 trains as it was usually not possible to distinguish between the different types of four and five coach trains. The results shown for the Class 350 in figure 3 are one of the few datasets where the train type could be confidently determined.

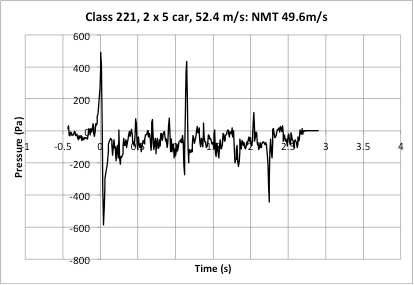

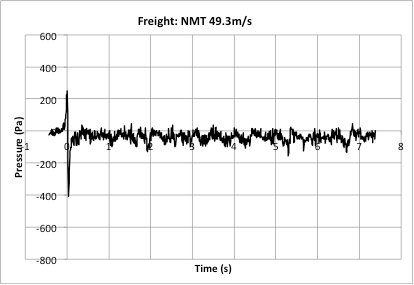
Figure 3 Train passing pressure transient types
As noted above, it is possible to determine the speed of Class 390 Pendolinos passing the NMT. This allows the dimensionless pressure coefficient to be determined (peak to peak pressure / (0.5 x density of air x velocity of approaching train squared)), which enables the effect of velocity on the peak-to-peak pressures to be removed in a consistent fashion. Pressure coefficient is plotted against train separation in figure 4 below. The train separation is calculated from the track spacing and the train geometry. Here again the data is less than ideal, and it was not possible to find accurate track spacings easily from NR databases. They were thus obtained from large scale digital OS maps, and are only accurate to within about 10cm. It can be seen that, as expected, the pressure coefficients fall with train separation. Perhaps the most notable point is the large variability of the data, which reflects both the uncertainties in track spacing described above, the effects of tilt and curvature and other operational variables. This level of variability is something that needs to be appreciated by both physical and computational models when assessing the engineering significance of their results.
Two other sets of data are shown on figure 4. The first is the pressure on trackside hoardings passed by a Class 390, measured in moving model experiments. These hoardings are about half train height, so one would expect some pressure relief as the disturbed flow passes over the hoarding, and indeed the pressure coefficients lie at the bottom end of the NMT measurements. One data point is also shown for the pressure coefficient measured in free air as a Pendolino passes. This can be seen to be about half the value of the pressure coefficients on the NMT at the same spacing.
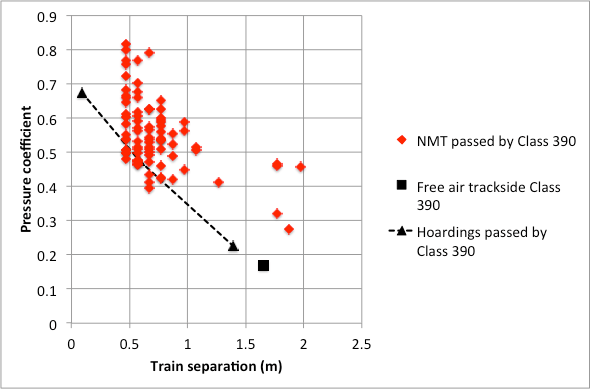
Figure 4 Effect of train spacing on peak-to-peak pressure coefficients
Despite not being able to determine train speeds for trains other than the class 390, the pressure data measured on the train is still reliable for all train types, and the overall type of train can be identified. Thus the overall distribution of peak-to-peak pressures can be determined. This is shown in figure 5 for Class 390, 4 or 5 car multiple units and freights trains, and in figure 6 for all train types. The lower cut-off magnitude for a pressure transient to be included was 400 Pa. It can be seen that the Class 390 transients, have a distribution from 400 to 1220 Pa, with the peak being between 1000 and 1200 Pa. The freight train distribution is from 400 to 1000 Pa, with the peak in the 600 to 800 Pa interval, reflecting the fact that, although freight locomotives can be expected to be aerodynamically blunt, they move relatively slowly and the absolute transient magnitude is somewhat less than for the express passenger trains. The four- or five-coach multiple units have a very broad distribution of peak-to-peak values, and the maximum pressure transient values experienced by the NMT are caused by such trains. The maximum peak-to-peak pressures that were measured in the trials (with values of 1449 Pa and 1498 Pa) were both identified as being caused by passing blunt nosed Class 350 units travelling at 46.7 and 47.7 m/s on the smallest centre-to-centre track spacing of 3.2m. These values both exceeded the standard value of 1444 Pa. The equivalent pressure coefficients in both cases were 1.10, somewhat higher than the values shown on figure 4.
This distribution of peaks is of course very specific to the route under consideration and the services that operate on it. However it does suggest that, for a mixed traffic railway such as the WCML, the range of pressure transient loadings on trains themselves is very large, and if any sort of fatigue loading calculation is required, then a suitable distribution such as that shown in figure 6 needs to be determined to give the required loading information. If maximum loads are required, then these are likely to result from passings by higher speed but aerodynamically blunt trains.

Figure 5 Distribution of pressure transients experienced by the NMT by passing train type
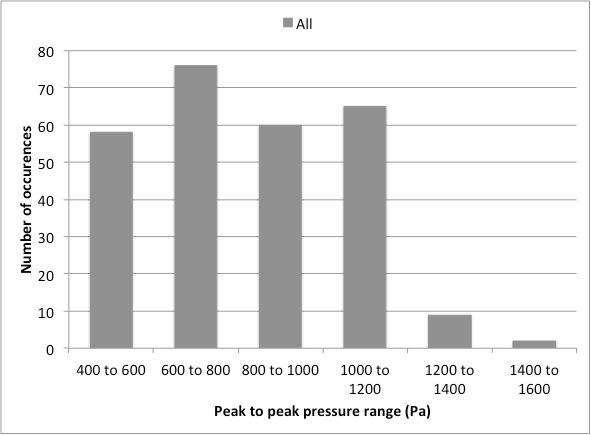
Figure 6 Distribution of pressure transients experienced by the NMT for all train types

One thought on “Train pressure transients on the West Coast Main Line in the UK”