

On March 23rd 2020 I was due to give a presentation with the above title to a Transportation Futures workshop at the University of Birmingham. Unfortunately the workshop has been cancelled because of the ongoing corona virus situation. Thus I am posting the slides I would have used here. In order that the file isn’t impossibly large for downloading, the slides are in handout form with the video clips removed. A brief commentary follows.
- Slide 1 – Introduction
- Slides 2 to 4 – these describe the Bridgewater Place incident in Leeds in 2013 in which a lorry blew over and killed a pedestrian that was the catalysts for much of the recent work that has been carried out. A report on the incident can be found here.
- Slide 5 gives typical comfort and safety criteria – the red outline indicates the safety criterion of relevance here.
- Slides 6 to 10 illustrate recent work on an EPSRC funded project entitled “The safety of pedestrians, cyclists and motor vehicles in highly turbulent urban wind flows” to investigate wind effects on people. This project involved wind tunnel testing, CFD analysis and the measurements on volunteers in windy conditions, which are reported here. Slide 7 shows a photo of Dr. Mike Jesson of the University of Birmingham who had responsibility for the work with volunteers. Measurements were made with shoe-mounted sensors to measure the volunteer’s walking pattern, and back-mounted sensors to measure acceleration. The results are shown in figures 8 and 9 and summarized in figure 10. The latter shows that at all gusts speeds above 6m/s stride “swing width” variation could be measured in some volunteers, where the volunteers subconsciously adjusted their stride to take account of crosswinds. The frequency of such events rose from around 40% at gust speeds of 6m/s to 100% at gust speeds of around 15m/s. Lateral accelerations of the torso first appeared at about 10m/s and reached a frequency of 100% at 17m/s. Actual instability of volunteers was only rarely recorded, but seemed to begin at gusts of around 15m/s. In general however, there was not enough data to draw firm conclusions. Perhaps typically for such measurements, the period of the project proved to be quite calm in wind terms overall.
- Slide 11 is a re-iteration of the safety criteria – all work of the type described above needs ultimately to be expressed in very, very simple terms to be useful.
- Slides 12 to 14 show the limited work that has been carried out on the effect of cross winds on cyclist safety – wind tunnel and CFD work supervised by Prof Mark Sterling and Dr Hassan Hemida whose pictures are shown in figure 3, to measure the aerodynamic forces on cyclists in cross winds, and some full scale work carried out under the EPSRC project, together with associated calculations of cyclist behavior. This work suffered even more than the pedestrian measurements from lack of suitable wind conditions and the results must be regarded as inconclusive.
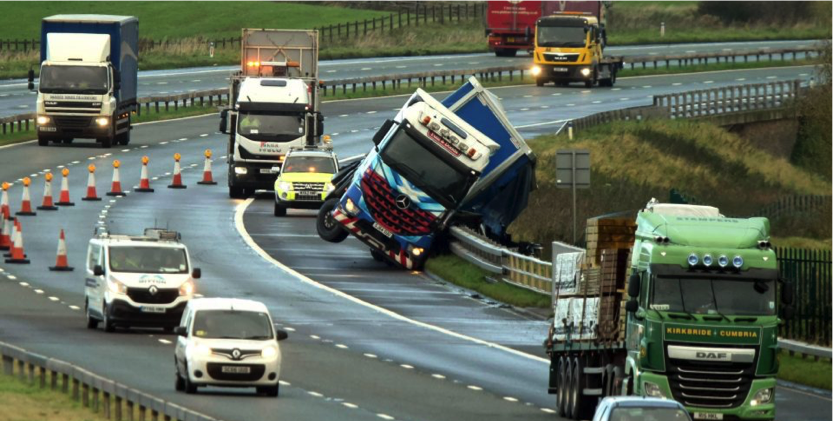
- Slides 15 and 16 begins the discussion of road vehicles in cross winds, with the latter showing the wind speed restrictions on Skye Bridge.
- Slides 17 to 19 illustrate the various methodologies for determining crosswind forces on road vehicles – full scale, wind tunnel and CFD. The former were carried out by Dr. Andrew Quinn, whose photograph is shown on Slide 17. These results lead to the curves of accident wind speed against wind angle shown on slide 19, which can be used to develop wind speed restrictions.
- Slides 21 to 24 summarise the study of bridge wind speed restrictions described in another post here. In finalizing restriction strategies operational conditions for specific bridges become very important, and in particular the ease or otherwise of restricting specific types of vehicle and not others.
- Slides 25 to 29 briefly describe the wind effect on trains. Methods of determining the aerodynamic forces are illustrated in figure 27, where the University of Birmingham moving model TRAIN rigis shown. These results were obtained by Dr Dave Soper, whose photo is shown on the slide. These forces can be used to calculate the curve of accident wind speed against vehicle speed in slide 28. The practicalities of imposing speed restrictions are illustrated in slide 29.
The overall message of the presentation was that, although investigations to determine the underlying physical processes involved are very important, the translation of the results into practice needs to take account of the sometimes severe operation constraints.
