
This post outlines some of the results from the project “The safety of pedestrians, cyclists and motor vehicles in highly turbulent urban wind flows” funded by the UK Engineering and Physical Sciences Research Council. The work that is described below involved a number of colleagues, whose contribution to the project was significantly greater than mine, particularly Dr Zhenru Shu, Dr Mike Jesson, Dr Andrew Quinn, and Prof Mark Sterling. Their contribution is gratefully acknowledged.
1. Introduction
The assessment of wind conditions around new buildings has become standard practice over recent years, either by wind tunnel testing or through the use of CFD calculations. The assessments usually concentrate on two aspects – the effect of wind conditions on human comfort and thus the usability of the area around the building; and the effect of high wind conditions on human safety and stability. It is with the latter that this paper is concerned. In general the criterion for assessing a site for pedestrian safety is based on a gust wind speed of a specified magnitude with a specified probability of occurring, that is deemed to be at the safety limit. Current UK practice is illustrated in Figure 1 below. There is a great deal of variability in the specification of this windspeed and the specification is usually based on largely subjective data from questionnaires etc. Following a fatality caused by high winds around a new building in the city of Leeds, a major research project was funded by the UK Engineering and Science Research Council to enable the University of Birmingham to investigate the safety of vehicles and pedestrians around high-rise buildings. This included full-scale wind measurements and the assessment of the ability of different wind tunnel and CFD techniques to replicate these measurements. In addition tests were carried out to make quantitative measurements of human response in gusty winds, using instrumentation mounted on volunteers. As will be appreciated by any reader who has tried to make full scale wind measurements of any type, the setting up of the experimental apparatus usually guarantees that strong winds will not occur, and the same phenomenon was observed for these tests. The two winter seasons that were available for these measurements had relatively few storms, and only two trials could be carried out. As a result, although some very interesting results were obtained and will be presented in what follows, they must be regarded as provisional and tentative. More work is required to obtain a fuller dataset of human response measurements of the type that are presented here.

2. The trials
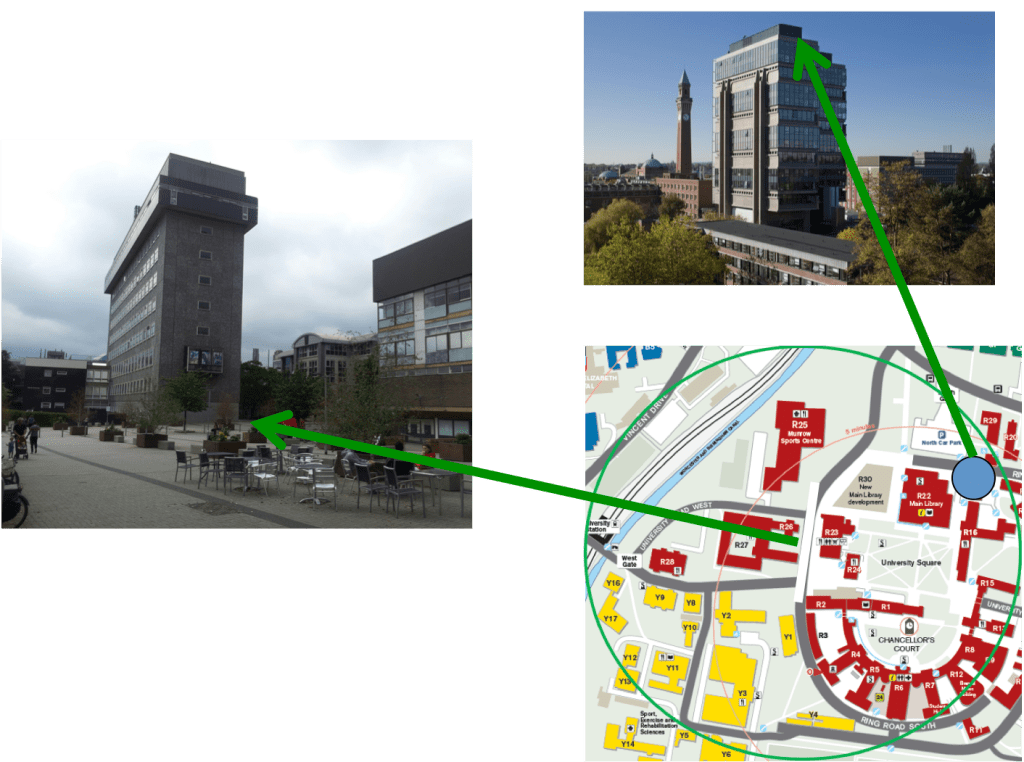
The trials on the response of pedestrians to high winds were carried out on the campus of the University of Birmingham (figure 2). A walking route of length 63m was set up in the centre of the campus. Eight sonic anemometers were placed 2m above the ground at 9m intervals along the route. A reference anemometer was installed at the top of the nearby high rise Muirhead Tower. A reference anemometer was mounted at the top of the Moorhead Tower. All the anemometers sampled at 10 samples / sec, and data was recorded on an AntiLog data logger. Human response was measured using GaitUp Physilog (combined accelerometer and gyroscope) sensors. Sensors were attached to both feet of the subjects, and provided details of walking speed and stride parameters every second through GaitUp’s proprietary software. A third sensor was placed on the back of a safety jacket worn by the subjects and thus gave details of upper body acceleration.
Two trials were carried out – October 2017 during Storm Ophelia, and in February 2019 (figure 3. In total there were 15 subjects, with weights ranging from 54 to 110kg, and ages between 28 and 75. Each subject was asked to walk along the test route 10 times in each direction during which the gait and acceleration information was measured.

3. Analysis
The overall wind conditions at the reference site on the Muirhead Tower are shown in figure 3 for the two test periods. It can be seen that in each case the wind is from the South-West (shown in longer term analysis to strongly be the prevailing wind direction), with gust speeds up to 18m/s
Before the data could be analysed, some data preparation was required. Firstly the gait data and accelerometer time series had to be synchronized with the anemometer time series of velocities and the raw accelerometer data was transformed into horizontal and vertical co-ordinates. The time series of velocity and direction relative to the subjects were then derived form the stationary anemometer data as the subject walked along the route. A histogram of gust speed distribution, as experienced by the volunteers, for the two trials is shown in figure 4.

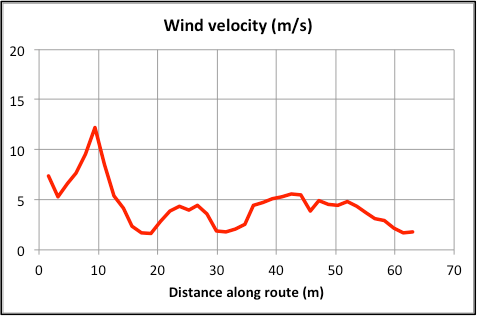
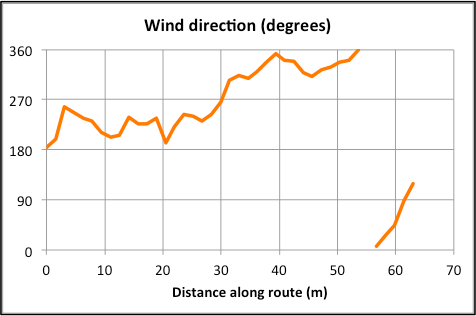
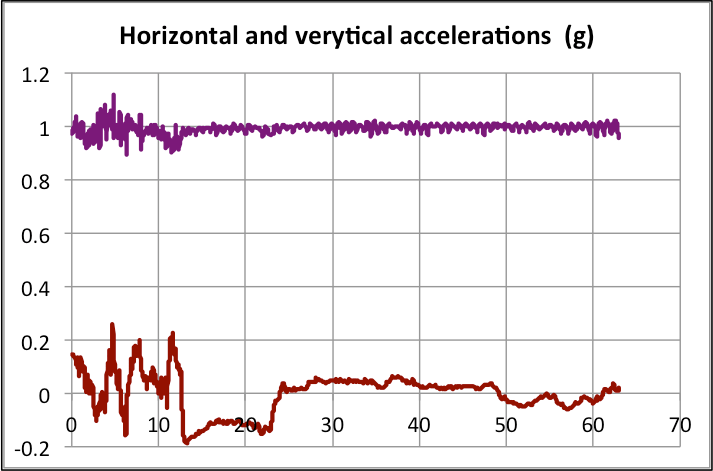
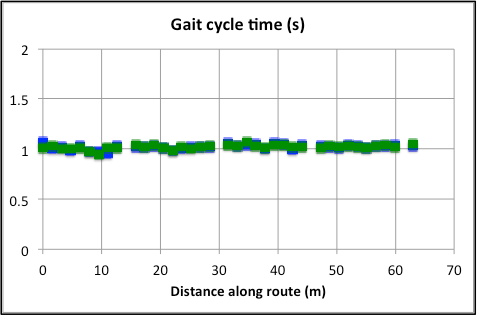
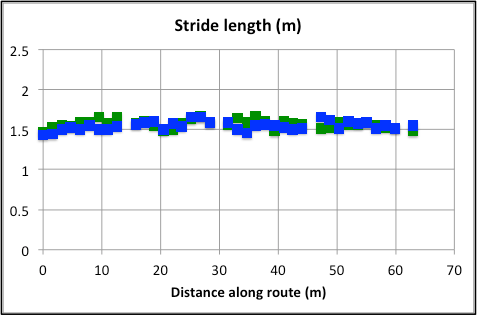
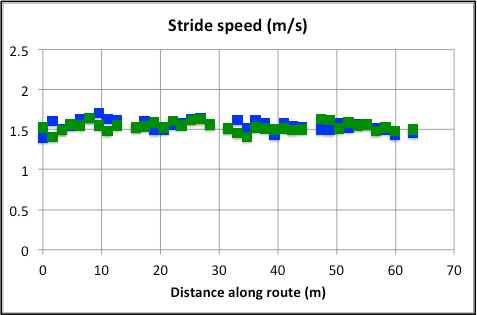
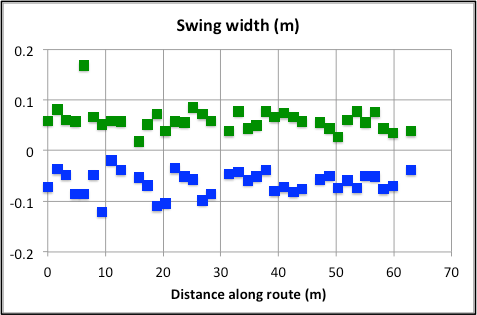
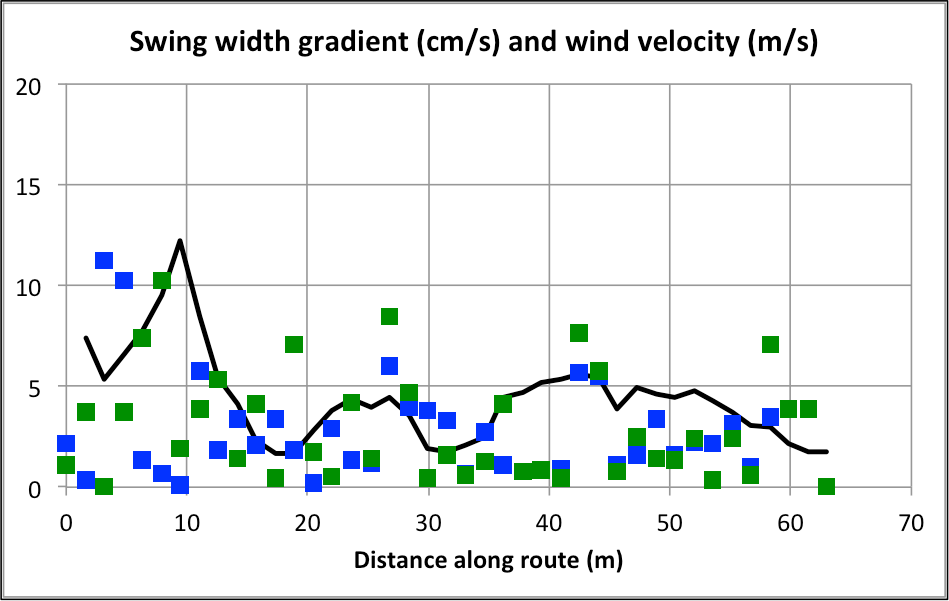
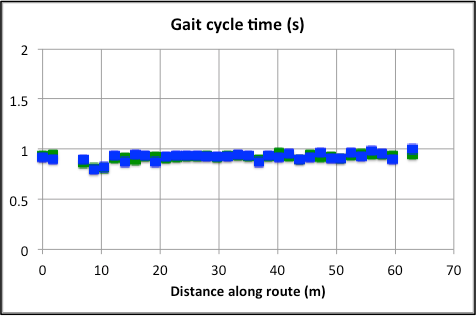
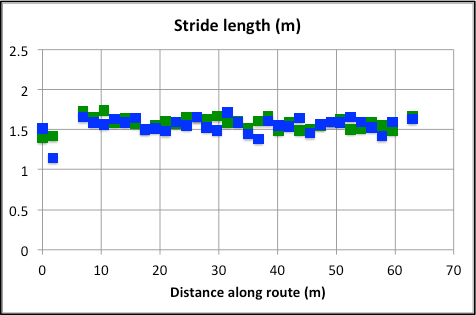
Initial inspection of the data showed that there was very significant variability between each recorded walk along the track. This was in part due to the normal variation in wind conditions with higher gust speeds on some walks than on other, but it also seemed that the reaction of subjects varied both with time and between subjects. A typical set of results is shown in figure 5. The direction of travel of the subject is from 0 to 63m. The wind speed relative to the subject can be seen to have a maximum of around 12 m/s in this case (associated with the corner flow from an adjacent building). The horizontal and vertical accelerometer data show slight oscillations around the gust position gust with the former having an average value of zero, and the latter an average value of 1.0. Most of the gait measurements (cycle time, stride length, stride speed) revealed little change in behaviour as the subjects walked along the route, all remaining approximately constant along the walk in most conditions. The one parameter that did show variation was the swing width – the lateral variation of the foot during a stride cycle. In particular rapid changes in swing width were sometimes (but not always) observed as the subjects encountered gusts – see the graph for swing width gradient.
At the highest gust speeds that were recorded, there were three events where the subject became unstable to a variable extent. Figure 6 shows the experimental data for one such case. Here it can be seen that at the gust position there are significant vertical and horizontal acceleration responses, and all the gait parameters show a response at the event. The swing width response is again the most noticeable.


A somewhat more quantitative approach to the data is possible by looking at the various responses statistically. In what follows we consider the results from both trials, for all subjects, as one dataset. Figure 7 shows the percentage of such gusts in which the subjects showed a swing width response (with either the left or right swing width changing by more than 0.06m in one second) and acceleration response (where an acceleration response greater than 0.05g could be detected) or an instability response (with an acceleration response greater than 0.4g). In considering these results the low number of gust events in the upper velocity bands need to be considered, as does the subjectivity of the response limits used. These points being made, it can be seen that for even low speed gusts of magnitude less than 10m/s, around 50% of the gusts result in a swing width response (which are mostly unconscious responses not registered by the subject). The frequency of such responses rise rapidly for gust speeds above 10 m/s, and all gusts over 14 m /s show such a response. Acceleration responses become significant at gust speeds of about 10m/s, and are observed for all gusts above 16m/s. Instability responses begin to occur at gust speeds over 14m/s, although it should be noted here that only a very small number of such events (3) were observed.

4. Concluding remarks
The results for human response in gusts presented here suggest that three levels of response can be identified – swing width response , upper body acceleration response and instability response, with the frequency of each such response increasing with wind speed. However it must be emphasised once more that the number of bot high speed gust events and the number of subjects was too small for a valid statistical analysis to be carried out, and more data is required before firmer conclusions can be drawn.
