
This post arises out of a discussion with a number of colleagues on the issue of train overturning, in particular Mr Terry Johnson and Dr Dave Soper. Their (perhaps inadvertent) contribution to the development of the ideas set out below is gratefully acknowledged, although the responsibility for any inadequacies and errors must remain mine.
1. Introduction
In recent decades a great deal of research has been carried out to investigate the safety of trains in high cross winds, primarily to determine the wind speeds at which overturning will occur, and the risk of a wind induced accident (Baker et al, 2019). This usually takes the form of the determination of the aerodynamic forces and moment coefficient for a particular train, the use of these coefficients to determine the cross wind characteristic (CWC) – effectively a plot of accident wind speed against vehicle speed – and then some sort of risk analysis on the route over which the train will run. The first two steps are usually the concern of train manufacturers and are undertaken when the design of the train, at least in terms of overall shape and size, is fairly well advanced. The third step is usually the concern of the infrastructure operator. One question that is not often asked however is whether there is a “best” design for a train to minimise the risk of a wind induced accident, and thus to maximise safety. This has been addressed to some extent by a number of recent investigations that used a combination of CFD methods to calculate the forces and moments on a train, and optimisation methods to consider the effect of changes to train geometry. It is not however clear as to what should be the objective function of such optimisation – for example a number of different force or moment coefficients for a range of different yaw angles could be chosen. This post addresses this issue though an analysis of accident risk and investigates the aerodynamic parameters required to minimise this risk
2. Aerodynamic force and moment coefficients
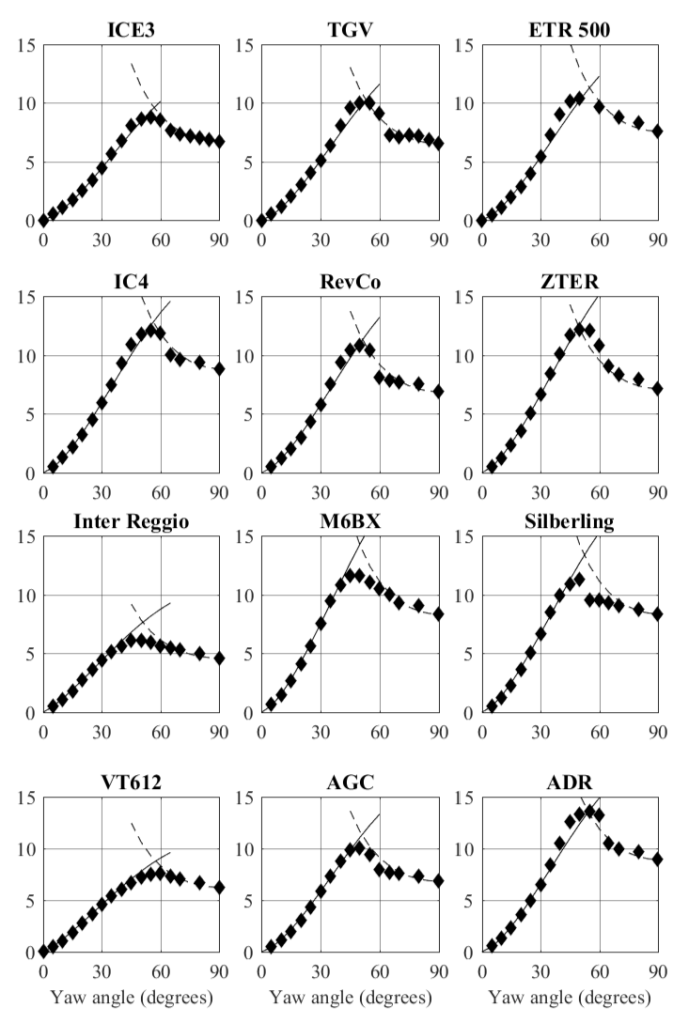
In a recent book (Baker et al, 2019) the author suggests a way of parameterising train aerodynamic force and moment data that seems to have a wide validity. This is set out in Box 1 below, in which the formulation for lee rail rolling moment coefficient is given, and is illustrated for a specific case. It applies equally well to side and lift force coefficient data. It can be seen that the form of the rolling moment / yaw angle curve is specified by four parameters – the coefficients at yaw angles of 30 and 90 degrees and exponent shape factors that describe the shape of curve, n1 and n2. Figure 1 shows a comparison of this methodology with side force coefficient data from the CEN codes (CEN, 2018) and the AeroTRAIN project (Paradot et al, 2015) as given in Baker et al (2019). All this data was obtained in a consistent way, with an STBR ground simulation in low turbulence wind tunnels. The agreement can be seen to be in general good and gives some confidence in the use of the parameterisation in what follows. The biggest discrepancy is in the transition region between the high and low yaw angle regimes, but it will be seen that this is not particularly critical to the argument that follows.

3. Crosswind characteristics
The method used to specify the crosswind characteristic is also taken from Baker et al (2019) and is set out in Box 2. Using this methodology, the CWC are functions of n1 and n2, the ratio of the moment coefficients at yaw angles of 90 and 30 degrees, and what is defined as a characteristic wind speed, which is itself a function of train and track parameters. Box 2 gives the formulation for flat straight track, with a wind angle normal to the track – a fuller form can be found in Baker et al (2019). A comparison of this method with the results from CEN (2018) and Paradot et al (2015) is given in figure 2, again from Baker et al (2019). Agreement can be seen to be good, and this gives further confidence in the use of the methodology in what follows.


Box 2 also indicates how the accident risk can be calculated for a specific reference site using the Weibull distribution to specify wind speed probabilities. We assume a section of railway of a specified length, with specified values of the Weibull parameters and a typical service pattern, and we then express the CWCs as a plot of train speed against the probability that a wind induced accident will occur in the section, rather than accident wind speed. This enables us to better address the question as to what is a “good” vehicle in cross wind terms, as it will highlight the relative importance in risk terms of different vehicle speed ranges.
4. Analysis
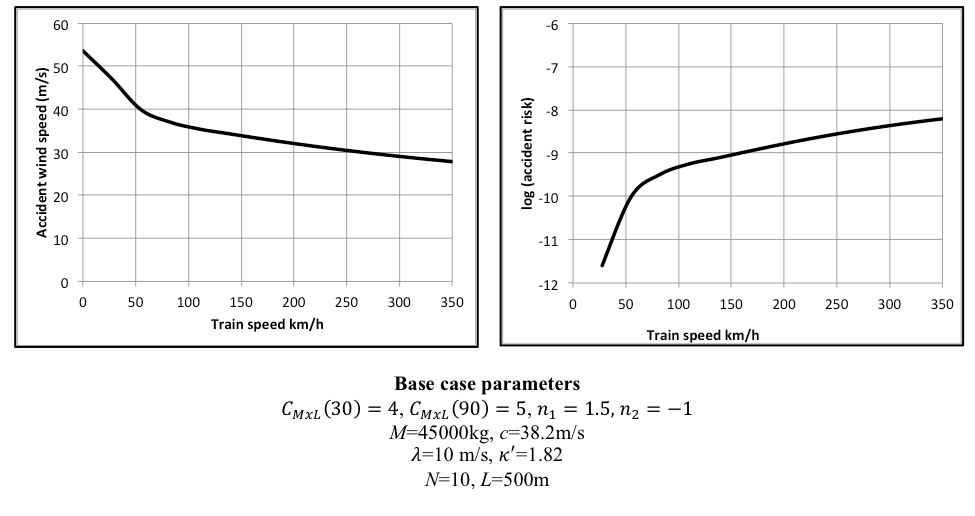
Figure 3 shows the calculated CWC, expressed as both an accident wind speed plot and as a risk plot, for what we will take as our base case. The parameters for this case are shown in the figure. The plot of accident wind speed against vehicle speed shows a reduction in the former as the latter increases, as would be expected. There is a break in gradient, at the point of transition between the low yaw angle (at high speed) and high yaw angle (at low speed) formulations of Box 2. Figure 2 shows that this is quite typical of the calculated CWCs from Paradot et al (2015). The plot of site risk against vehicle speed shows an increase in risk with the vehicle speed. At the vehicle speed of 350 km/hr the logarithmic risk is around -8 (but remember that this absolute value is completely arbitrary). The risk falls by an order of magnitude as the speed decreases through the low yaw angle range to around 100 km/h, with an increased rate of fall for low speeds, where the high yaw angle formulation becomes relevant.
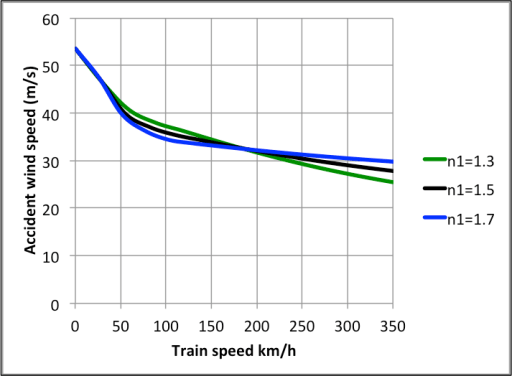
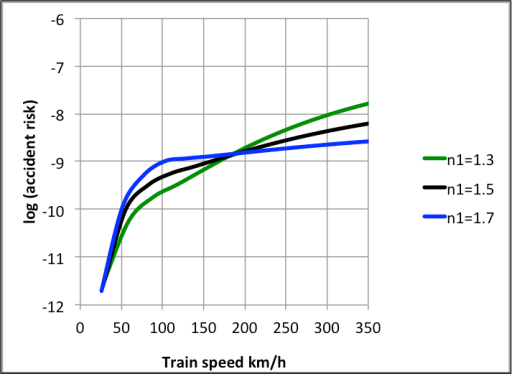
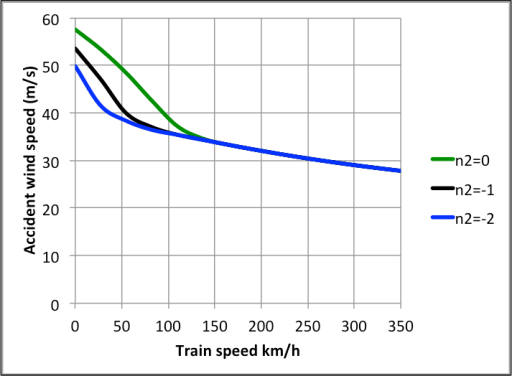
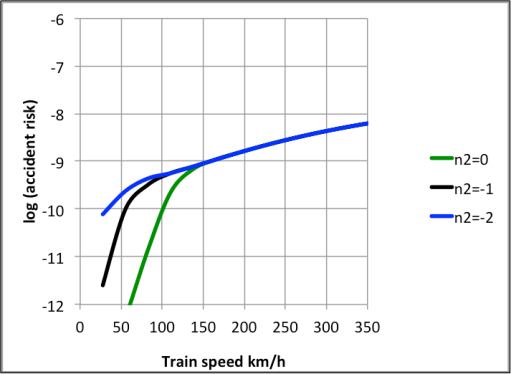
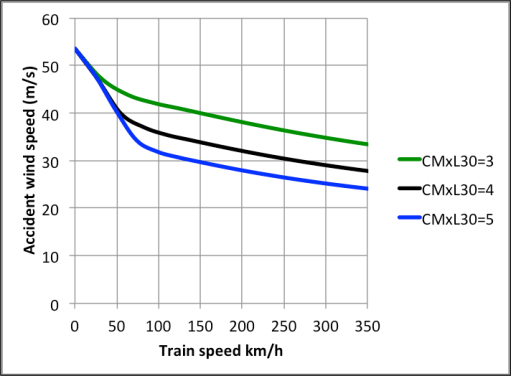
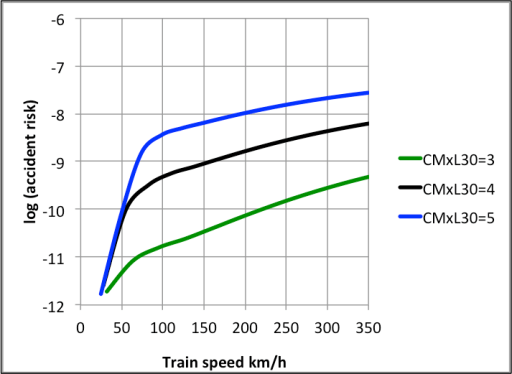
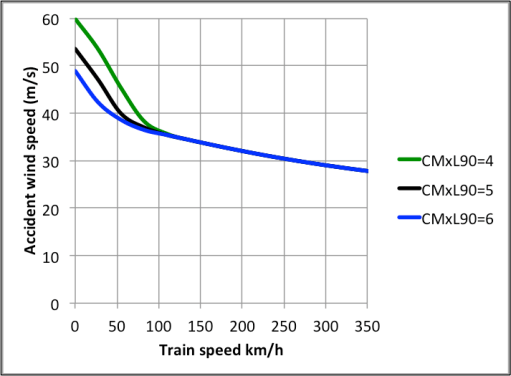
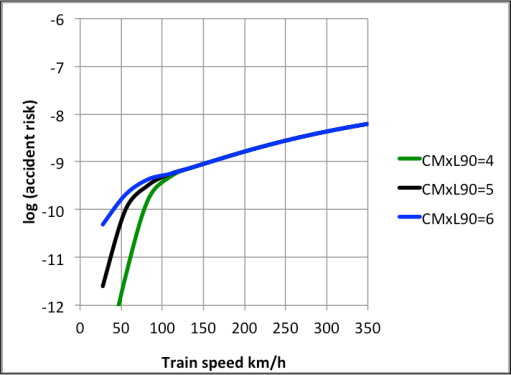
Figures 4 to 7 show the effect on the CWCs of changing the parameters for the moment characteristics. As the low yaw angle exponent n1 is varied between 1.3 and 1.7, there are variations of about half a magnitude in risk for the higher train velocities, although this varies through the speed range. This parameter is typically around 0.9 to 1.1 for lorries, 1.2 to 1.4 for blunt nosed trains, 1.4 to 1.6 for streamlined trains, and 1.7 to 2.0 for trailing vehicles. As the high yaw angle exponent n2 is varied, the variations in accident velocity and risk are confined to the low speed range as would be expected, although here the variations in risk can be several orders of magnitude. As the lee rail rolling moment coefficient at 30 degrees is varied between 3 and 5, there can be seen to be very significant variations in both accident wind speeds and risk throughout the speed range. For variations in the lee rail rolling moment coefficient at 90 degrees only the low speed accident wind speeds and risk levels are affected as would be expected. From these graphs it can be concluded that the risk of an overturning accident will be reduced for high vehicle speeds if n1 increases and the lee rail rolling moment coefficient at 30 degrees decreases; and for low vehicle speeds if n2 increases (becomes less negative) and the lee rail rolling moment at 90 degrees decreases. Of the parameters the 30 degree coefficient produces most change in accident wind speeds and risk levels across the speed range, and is perhaps where most design effort should be concentrated.
Now let us consider specific trains. Table 1 shows, for the CEN (2018) and AeroTRAIN (Paradot et al, 2015) trains, the maximum train speed, the values of the four parameters that define the rolling moment characteristic, the characteristic velocity, and the risk at the maximum operating speed. Those shaded red indicate values that would increase risk significantly above the average, and those shown in green indicate values that would decrease risk significantly the average. It can be seen that of these trains the ICE3, IR and Silbering has the “best” values of rolling moment coefficient. For the ICE3 this is presumably due to the nose shape, resulting in low levels of lift and side force, and thus rolling moment. For the IR and Silberling however, these low values are due to the lack of underbody blockage, at least as modelled in the wind tunnel tests. The ICE3 values of n1 and n2 are around the average, whilst those for the IR and Silberling are low, and would thus tend to increase risk. The worst train in terms of rolling moment coefficients is the double deck M6BX. The IC4, RevCo and ZTER also have high values of the coefficient at 90 degrees.

The risk at the maximum speed for the all trains, with one exception, is between -7.3 and -8.4 i.e. it varies by one order of magnitude. The ICE3, TGV, ZTER and IR have the lowest risk and the M6BX the highest for the standard site. This risk variation is perhaps less than would be expected, and is partly caused by the reduction in risk with the reduction in maximum operating speed. The outlier from the range of -7.3 to -8.4 is the ADR, which has a low value of -9.1, which is due to its high mass and high resulting characteristic velocity.
Concluding remarks
From the above, it can be seen that for high speed trains, the aerodynamic parameter that most affects the overturning risk is the lee rail rolling moment coefficient in the low yaw angle range, characterised by the value at 30 degrees. In these terms the ICE3 shape is “best”. However this does not necessarily apply for lower speeds, when the higher yaw angle range becomes of importance. These points being made there are some important caveats.
- The overturning wind speed and thus accident risk depends upon a range of parameters as well as the aerodynamic characteristics. Train mass is particularly important.
- Similarly the infrastructure characteristics are important, and accident wind speed and risk will be affected by can’t and topography.
- Perhaps most importantly, the level of risk is determined by the nature of the train operation itself – if speed limits are imposed in high winds, it is quite possible that the most important aerodynamic characteristics will move from those in the low yaw angle range to those in the high yaw angle range.
One further point is of interest. In Baker at al (2019) the head pressure pulse magnitudes and wake slipstream gust velocities are tabulated for orange of trains. Of those trains included, the Velaro (i.e. the ICE3) has both the lowest pressure pulse magnitude and the lowest slipstream gust velocities, suggesting that the nose / tail shape of this train has considerable aerodynamic advantages.
References
Baker, C., Johnson, T., Flynn, D., Hemida, H., Quinn, A., Soper, D., Sterling, M. (2019) Train Aerodynamics – Fundamental and Applications, Elsevier.
CEN, 2018. Railway applications — Aerodynamics — Part 6: Requirements and test procedures for cross wind assessment. EN 14067-6:2018.
Paradot, N., Gregoire, R., Stiepel, M., Blanco, A., Sima, M. et al., 2015. Crosswind sensitivity assessment of a representative Europe-wide range of conventional vehicles. Proceedings of the Institution of Mechanical Engineers. Part F Journal of Rail and Rapid Transit 229 (6), 594-624.

2 thoughts on “Train crosswind performance – is there a “best” shape?”