
Introduction
Up till recently most attention had been focused on the spread of Covid-19 by near field transmission – being in close proximity to an infected person for a certain amount of time, and rather ad hoc social distancing rules have been imposed to attempt to reduce transmission. However, there is another aspect of transmission – the gradual build up of pathogen concentrations in the far field in enclosed spaces due to inadequate ventilation. The importance of this mode of transmission is beginning to be recognised – see for example a recent seminar hosted by the University of Birmingham. The main tool that seems to have been used for both near and far field dispersion is Computational Fluid Dynamics (CFD) – see the graphic above from the University of Minnesota for example. Now whilst such methods are powerful and can produce detailed information, they are very much situation specific and not always easy to generalise. This post therefore develops a simple (one could even say simplistic) method for looking at the far field build up of pathogens in an enclosed space, in a very general way, to try to obtain a basic understanding of the issues involved and arrive at very general conclusions.
The model
We begin with equation (1) below. This is a simple differential equation that relates the rate of change of concentration of pathogen in an enclosed volume to the pathogen emitted from one or more individuals via respiration and the pathogen removed by a ventilation system. This assumes that the pathogen is well mixed in the volume and is a simple statement of conservation of volume.
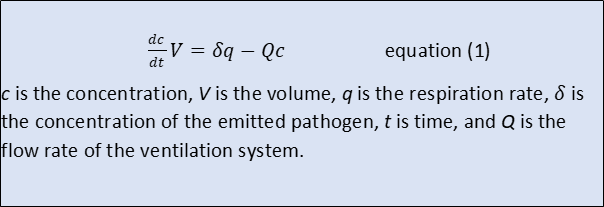
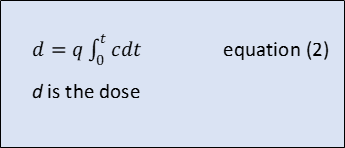
From the point of view of an individual, the important parameter is the pathogen dose. This is given by equation (2) and is the volume of pathogen ingested over time through respiration. The respiration rate here is assumed to be the same as that of the infected individual.
Equations (1) and (2) can be expressed in the normalised form of equations (3) and (4) and simply solved to give equations (5) and (6).

Equations (5) and (6) are plotted in figures 1 and 2. Note that an increment of 1.0 in the normalised time in this figure corresponds to one complete air change in the enclosed volume. It can be seen that after around three complete air changes the concentration of pathogen reaches an equilibrium value and the dose increases linearly, whatever the starting concentration. To the level of approximation that we are considering here we can write the relationship between normalised dose and time in the form of equation (7), which results in the non-normalised form of equation (8).
Assuming that there is a critical dose, the critical time after which this occurs is then given by equation (9).

Equation (9), although almost trivial, is of some interest. It indicates that the time required for an individual to receive acritical dose of pathogen is proportional to the volume of the enclosure and the ventilation rate. This is very reasonable – the bigger the enclosure and the higher the ventilation, the longer the time required. The critical time is inversely proportional to the concentration of the emission, which is again reasonable, but inversely proportional to the square of the respiration rate. This is quite significant and a twofold increase in respiration rate (say when taking exercise or dancing) results in the time for a critical dose being reduced by a factor of 4, or alternatively the need for ventilation rate to increase by a factor of 4 to keep the critical time constant. Similarly if there are two rather than one infected individuals in the space, then the respiration rate will double, with a reduction in the critical time by a factor of four.
Discussion
Now consider the implications of this equation for two specific circumstances that are of concern to me – travelling on public transport (and particularly trains) and attending church services. With regard to the former, perhaps the first thing to observe is that there is little evidence of Covid-19 transmission on trains, and calculated risks are low. In terms of the far field exposure considered here, respiration rates are likely to be low as passengers will in general be relaxed and sitting. This will increase the time to for a critical dose. On modern trains there will be an adequate ventilation system, and the time to reach a critical dose will be proportional to its performance. Nonetheless the likelihood of reaching the critical level increases with journey time – thus there is a prima facie need for better ventilation systems on trains that undergo longer journeys than those that are used for short journeys only. For trains without ventilation systems (such as for example the elderly Class 323 stock I use regularly on the Cross City line) has window ventilation only, and in the winter these are often shut. Thus ventilation rates will be low and the time to achieve a critical dose will be small.
Now consider the case of churches. Many church buildings are large and thus from equation (9) the critical times will be high. However most church buildings do not possess a ventilation system of any kind, and ventilation is via general leakage. Whilst for many churches this leakage this can be considerable (….the church was draughty to day vicar….), some are reasonable well sealed – this will thus, from equation (9) tend to reduce the critical time. In this case too the respiration rate is important. As noted above the critical time is proportional to the respiration rate squared. As the rate increases significantly when singing, this gives a justification for the singing bans that have been imposed.

The above analysis is a broad brush approach indeed, and in some ways merely states the obvious. However it does give something of a handle on how pathogen dose is dependent on a number of factors, that may help in the making of relevant decisions. To become really useful a critical dose and initial pathogen concentration need to be specified together with site specific values of enclosed volume, ventilation rate and expected respiration rates. This would give at least approximate values of the time taken to reach a critical dose in any specific circumstance.

One thought on “Some thoughts on ventilation and pathogen concentration build up”