
Introduction
In a recent blog post, I investigated the registers and monumental inscriptions surveys of the churchyard of St Michael’s in Lichfield, to see if they contained traces of the effects of the 1918 flu pandemic. This was made possible by work carried out over the last decade where I collated both sets of records into a searchable spreadsheet. It turned out that there was significant excess mortality recorded at the time of the 1918 pandemic and that the age profile of this excess mortality matched that associated with the pandemic i.e. excess mortality in the age ranges from 20 to 50 (approximately).
The obvious follow up to such work was to further investigate the St Michael’s database to attempt to identify other periods of significant excess mortality in the Lichfield area, and this is addressed in this blog post. In the next section an outline of the methodology that was used is set out. This leads to the identification of a number of periods of high mortality, that were then investigated further with regard to the excess mortality age profile. The results were then interpreted using limited historical data from other records.
Methodology
The methodology that was adopted is as follows.
- The period from January 1840 to December 1940 was chosen for the analysis. For this period, earlier work has shown that the number of burials per year in St. Michael’s churchyard remained roughly constant, and was around 15% of the total number of deaths in the larger Lichfield Civil Registration area.
- The number of burials each month was extracted from the data and tabulated by year and month.
- For each month, the average of the monthly deaths for that month in the preceding five years and the five years that follow was obtained.
- The ratio of the actual monthly data to the average monthly data was then obtained for each month (R). A value of less than 1.0 thus indicated that the monthly data was below the average for 10 years around that period, and a value above 1.0 indicated that the data was above that average.
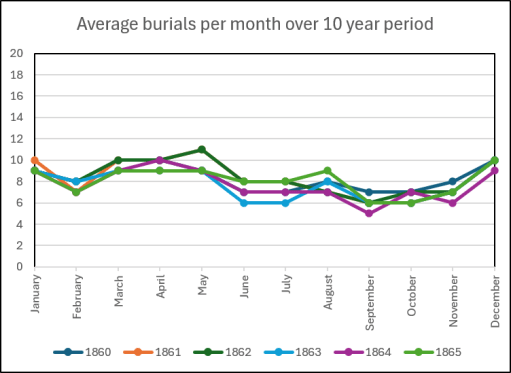
As an example of this process, consider the period from 1860 to 1865. Firstly Figure 1a shows the number of burials by month over that period. It can be seen that, unsurprisingly, there is much month by month variability, but that there seem to be an unusual number of deaths in the first half of 1863. Figure 1b shows the 10 year averages, based on the same month 5 years before and 5 years after. The graphs for each year can be seen to be generally similar with a slight variation across the months. Figure 1c shows the ratio of the actual and mean values (R). Again the 1863 values stand out quite clearly.

a) Monthly burials from 1860 to 1865
b) Average monthly burials five years before and five years after the month in question
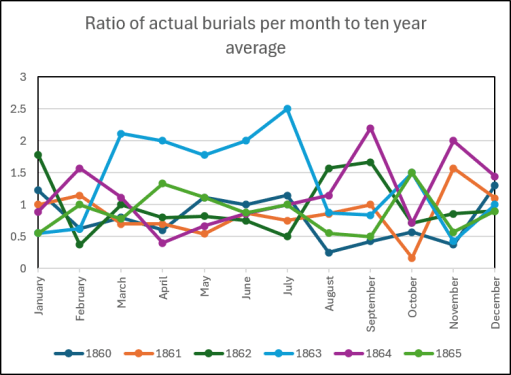
c) The ratio R of the data in figures a and b
Figure 1 Example of monthly data analysis
Identification of high mortality events
The criteria that were adopted for determining events for more detailed study were that firstly the ratio of actual burials to average burials (R) should exceed 1.7 for at least two consecutive months, and that secondly at least one month should have a value of R of greater than 2.0. Only those events with more than 30 deaths overall were chosen. This process resulted in seven events being identified and these are given below. The list shows the R value for each month; the total number of deaths in the period; the expected deaths in each period (the average values for 5 years before and 5 years after); and the excess deaths over the period (the difference between the last two values).
- 1846 August (R=2.8); September (R=2.6); Actual deaths 33, Expected deaths 12; Excess deaths 21
- 1863 March (R=2.1); April (R=2.0); May (R=1.8); June (R=2.0); July (R=2.5); Actual deaths 80, Expected deaths 39; Excess deaths 41
- 1883 September (R=1.7);October (R=2.7); Actual deaths 31, Expected deaths 14; Excess deaths 17
- 1895 February (R=1.7); March (R=2.3); Actual deaths 38, Expected deaths 22; Excess deaths 16
- 1899 March (R=1.8); April (R=2.0); Actual deaths 41, Expected deaths 22; Excess deaths 19
- 1918 October (R=4.6); November (R=2.8); Actual deaths 45, Expected deaths 13; Excess deaths 32
- 1940 January (R=2.3); February (R=3.0); Actual deaths 42, Expected deaths 16; Excess deaths 26
As might be expected the 1863 data of figure 1 features in the list.
Analysis of events by age at death
The next step was to breakdown the number of deaths in each event by age, in intervals of ten years. As an example, the 1863 results are shown in Figure 2a. Similarly the deaths in the periods of 5 years before and 5 years after each event were broken down by age. These were then factored by the ratio of the number of deaths in the event and the overall number of deaths in the 10 year period, to calculate what might be called the expected number of deaths during the event. Figure 2b shows such values for the period 1858 to 1862 and 1864 to 1858. It can be seen that, in this case, the number of burials in the 0 to 9 age group greatly exceeds the expected value, a point that will be taken up in what follows. The differences between the values in the two graphs will be referred to as the excess deaths in what follows.
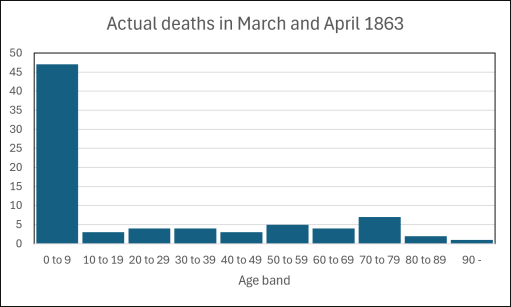
a) Age at death breakdown for 1863 event
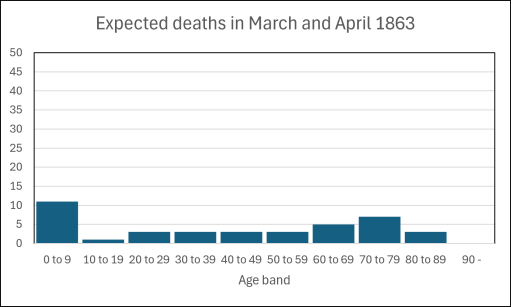
b) Expected age at death breakdown from 1858 to 1862 and 1864 to 1868
Figure 2. Breakdown of burials by age for 1863 event
The above procedure was then carried out for all seven identified events and the breakdown of excess deaths by age is shown in Figures 3a to 3g. The first three events (1846, 1863 and1883) are all of the same form, and show that the excess deaths are concentrated in the 0 to 9 age group, which was a period of high child mortality in any case. But the concentration or excess deaths in this age band are striking. The 1895 and 1899 events are different in form, with excess mortality in the older age groups, particularly for those over 60. The 1918 event by contrast shows excess mortality spread across the mid age range. The final 1940 event shows a large peak of excess mortality in the 60+ age range.
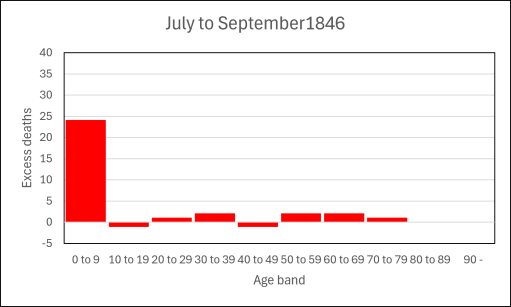
a) 1846 event
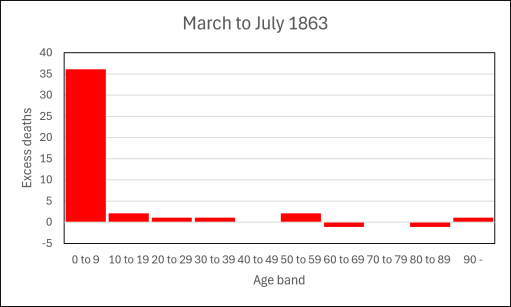
b) 1863 event
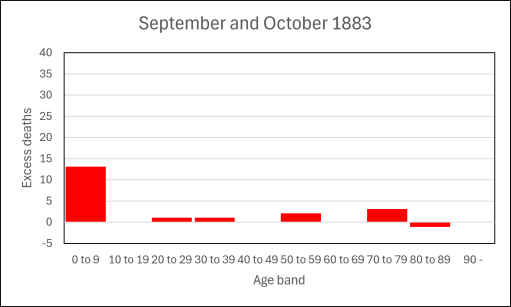
c) 1883 event
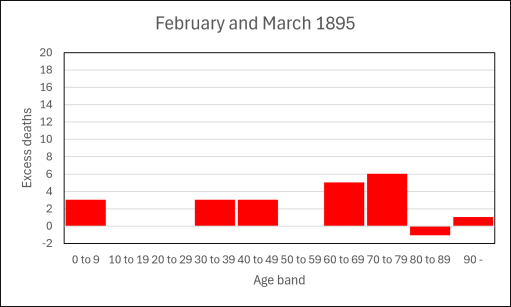
d) 1895 event
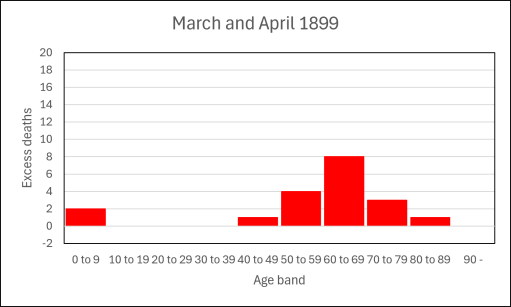
e) 1899 event
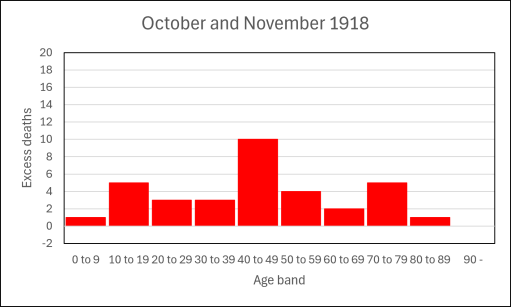
f) 1918 event

g) 1940 event
Figure 3.Excess deaths for each of the identified high mortality events
Interpretation
The question then arises as to whether any more can be said about the causes of the events from the historical record. For the last two events that proves to be the case. The 1918 event shows the effects of the Spanish Flu pandemic in Lichfield, and this was widely reported in the local press and that I considered in the earlier post. An analysis of the burial register for the 1940 event indicates that 18 of the 42 deaths in that period were elderly patients in the former Workhouse Infirmary, which would suggest that there was some sort of localised outbreak there. This was however, not reported in the press. The first five events listed above do not seem to have been recorded in any historical sources, and their cause must remain unknown. Conversely the major flu epidemic of 1889 / 1890 (the Russian Flu) has left no trace in the St. Michael’s burial records.
There is some indication of the effects of climate for the 1895 and 1940 events. February 1895 was the coldest February in the entire period from 1840 to 1940, with an average central England temperature of -1.8 degrees , and one of only two years below zero. The average over the period was 4.1 degrees. January1940 was also the coldest January in the entire period at -1.4 degrees against and average of 3.7 degrees. It was one of only three years below zero. Old people seem to have been particularly affected in these two events.
But the numbers and the age profiles of the events surely hide many stories; the concentrated grief of many parents losing their children in a short space of time in 1846, 1863c and 1883; the loss of elderly and much loved parents in 1895 and 1899; the incomprehension of the loss of the young and healthy in the Spanish flu of 1918; and the despair of the community in the dark days of 1940 that the place of safety and rest in the infirmary should become a place of death. The names of all those who died are recorded and for some the inscriptions on the memorial stones were recorded, even if the memorials can no longer be found. Perhaps one of the most poignant is that to the Hitchins children of Butchers Row who died during or close to the 1846 event.
Sacred to the memory of SARAH ANN HITCHINS who died July 25th 1846 aged 7 years. Also of HENRY WRIGHT HITCHINS who died August 5th 1846 aged 9 years. And of ADELAIDE HITCHINS who died November 15th 1846 aged 3 years.
There is perhaps one other individual who does come into sharper focus. Nearly all the burials in the 1846 and 1863 events were conducted by the Perpetual Curate (vicar) Thomas Gnossall Parr. More is told about him here. But the emotional trauma that he would have experienced as he buried the children of many of his parishioners must not be underestimated. He would no doubt have had a degree of professional detachment, but nonetheless he would have been faced with the raw grief and despair of many of his parishioners for whom he had the cure of souls. The strain of parish ministry in such circumstances is so often forgotten.