The measurements reported in this post were made by colleagues of the School of Engineering at the University of Birmingham – Dr David Soper and Dr Mike Jesson – whose help is gratefully acknowledged.
Introduction
Over the course of the Covid-19 pandemic, there has understandably been increased concern over ventilation within buildings and on buses and trains etc. This has been reflected in church circles where church ventilation has also been much discussed. Whilst more modern churches will have been specifically designed with ventilation in mind, with proper ventilation paths between windows and doors, the same cannot be said about older churches. For many such churches the only ventilation is offered by the opening of doors, and by leakage through windows and roofs. Because of the large vertical size of such buildings, this lack of ventilation is ameliorated by the ability of any pollutants of pathogens to diffuse throughout the large church space.
One such church is St. Michael on Greenhill in Lichfield (figure 1 below), which is essentially two large, connected boxes – a nave, and a chancel, with a main door in the north wall of the nave and a smaller door into the choir vestry on the south side, and internal doors between the vestry area, the nave and the chancel (figure 2). A though ventilation path is rarely established however as the external and internal doors are seldom open at the same time. There are plans to build new parish rooms to the south of the church, on the grassed area of the figure below.


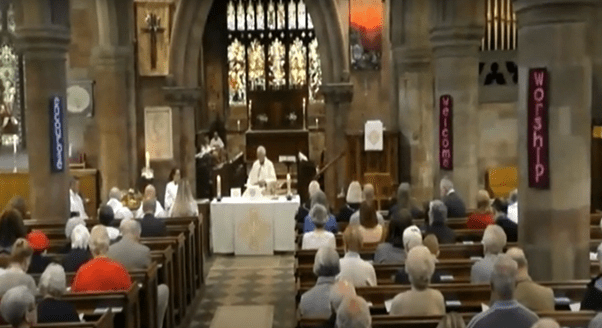
This brief post outlines a short series of measurements to measure carbon dioxide (CO2) levels in St. Michael’s. CO2 is produced naturally by people during breathing and CO2 concentration levels are often taken to be an indication of pathogen levels when the population is infected. These measurements were made on Sunday May 15th 2022, when the service pattern was somewhat different from normal, with the normal 8.00 and 10.00 Holy Communion services supplemented by the Annual Parochial Church Meeting (APCM) at 11.15 and a 4.00 service at which a new Rector was Instituted by the Bishop and Archdeacon. As such it gave the opportunity to look at the effects of different congregation numbers (10 in the chancel for the 8.00 service, 50 for the 10.00 service and the APCM, and 150 for the Institution). A screen shot of a video of the Induction service is shown in figure 3 to give some idea of the density of the congregation.
The measurements
Carbon Dioxide measurements were made with small transducers and data loggers at different points around the church. These were attached to pillars of left on suitable window ledges. These sampled automatically every minute and the results were transmitted wirelessly to a Raspberry Pi computer and from there to a University of Birmingham web site from where the data could be accessed in real time. These measurements were supplemented by measurements of temperature and pressure using further transducers with built in data loggers.
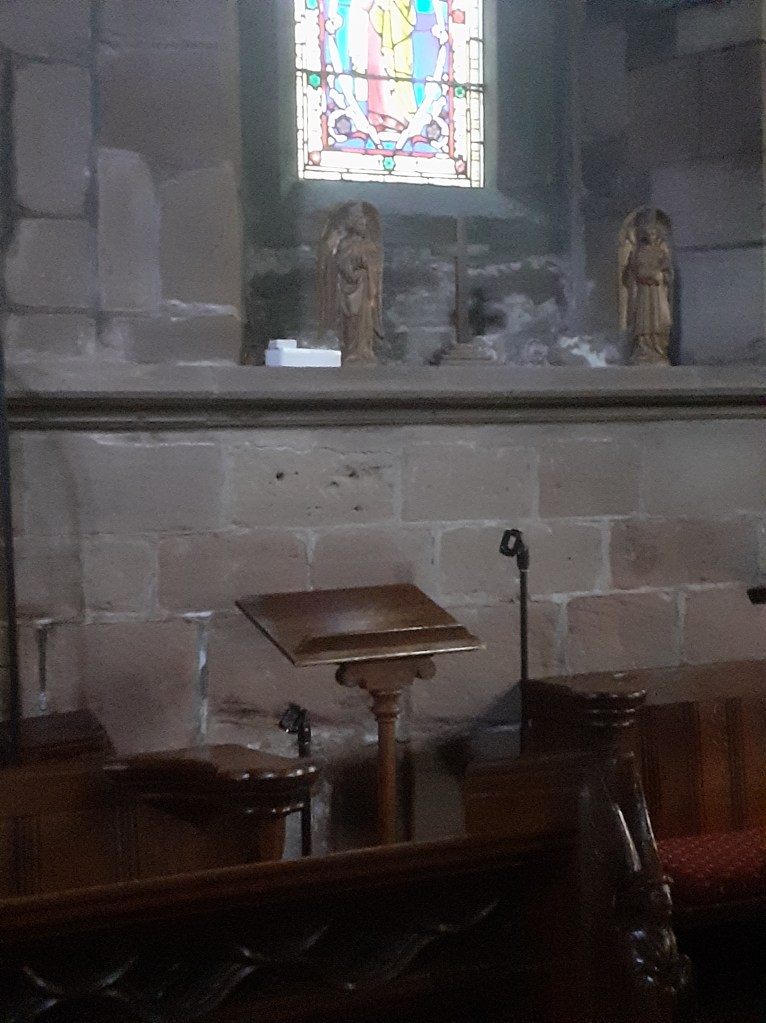
For the sake of simplicity only the results from two of the CO2 sensors will be shown, as the results from them all were very similar. The location of these are shown on the plan of Figure 2 – one on a pillar in the nave, and one on a window ledge in the chancel. The photographs of the instruments shown in figure 4 indicate that they are quite small and discrete and indeed were barely noticed by the congregation. The results will be presented from midnight on Saturday May 14th to midnight on Sunday May 15th.

The results of the trials
The weather on May 15th was quite pleasant with early morning temperatures of 10°C rising to around 20°C in the late afternoon and evening. The external humidity varied from 20% to 100% throughout the day. Inside the church however there was far less variation with temperatures between 16 and 21°C and humidity between 55 and 70%. The was a light southerly wind in the morning, with a somewhat stronger easterly wind from mid-afternoon onwards.
The results of the CO2 measurements are shown on the graph of figure 5. These are shown in terms of parts per million (ppm) of carbon dioxide in the atmosphere by volume and are relative to a general background level of around 400 ppm.

The church was opened at around 7.30 am for the 8.00 Holy Communion service held in the chancel, which went on until till around 8.45. Around 10 people attended. There can be seen to be a small increase in CO2 levels in the chancel over the course of the service (A). Later in the morning there was a 10.00 Holy communion service in the nave with around 50 in the congregation, with a small choir of 4 or 5 in the chancel. This was followed immediately by the APCM from 11.15 to 11.45 in the nave with about the same number attending. During this period there can be seen to be a steady increase in CO2 levels both in the nave and the chancel (B). At 12.00 the church emptied and the doors were closed. This led to a steady decrease in concentrations (C) till about 2.00 when people started to arrive at the church to set up for the major service of the day – the Institution of the new Rector by the Bishop of Lichfield. At this point both the main door and the choir vestry door were opened (as Gazebos were being set up to the south of the church for refreshments after the service), and a ventilation path was opened through the church, with major CO2 concentration reductions (D). Around 3.00 the congregation for the 4.00 Induction service began to arrive and the church rapidly filled with around 150 attending, including a choir of around 20 in the chancel. There were significant increases in CO2 concentrations during the course off the service through till around 5.30 (E). When the service was over, both the main door and the choir vestry door were again opened, and there was a rapid drop in concentration levels till around 7.00 when the choir vestry door was closed (F). After some clearing up, the church emptied by around 8.00 and there was a gradual fall off in concentration levels (G).
Two main points emerge from these measurements. Firstly, and quite obviously, the levels of CO2 increase with the number of people in church and with the time they spend there – B and E on the above figure. Secondly it is clear that there are two different types of ventilation – the slow diffusion of CO2 throughout the building and leakage through the building envelope – roof, doors, windows etc. (C and G); and the rapid lowering of concentration levels when there is a direct ventilation path through the building between the two doors (D and F).
Now from the slope of the graph for the times when concentrations are falling, it is possible to get estimates of the time it takes for the concentrations to fall by 50%. For C and G these times are around 2.5 hours, whilst for D and F these times are between 10 and 30 minutes. Thus the through ventilation reduces the carbon dioxide levels much more quickly than simple diffusion and leakage.
Implications
The results show firstly that the method that was used is a simple and viable way of assessing the main ventilation parameters in a church. Colleagues from the University of Birmingham recognise that there is still work to on improving the frequency response of the sensors but overall the method has much promise. Secondly there are some implications for St. Michael’s itself – that large congregations in the church for lengthy periods of time can result in significant CO2 concentrations (and thus pathogens in times of infection), and that through ventilation is much more effective in reducing these concentrations than simply relying on diffusion and leakage. In the Parish Rooms developments that are under consideration for the area adjoining the choir vestry, it may be worth investigating if it is possible to design through ventilation paths through the church and the new development.
