A walk around Oakham

The walk

This is a picture blog, that simply gives pictures of a walk around Oakham. This is not a walk that takes in the traditional historical highlights, although some of those are included, but is rather one in which I show the things that have caught my eye, mainly on my wonderings about the town with the dog. So it is a little idiosyncratic, but I hope will be of interest to some. Except where otherwise indicated, the pictures were all taken by me, and I am happy for them to be used by others, properly credited of course.

The map

The map below shows the approximate locations from which the photographs (A to R) were taken, superimposed on an up to date map from Open Street Map.

The pictures

The first picture is of the listed Midland Railway bridge and level crossing (Picture A) a source of endless frustration to drivers, and, as the location of the meeting of five roads, a horribly hazardous place for pedestrians. There must be a better way of doing traffic management here. Picture B is the Midland Railway Signal Box, which was the inspiration for the Hornby Railway model. Turning along Northgate, there are three pictures of rose bushes (Pictures C to E), some cultivated, some not. but in early summer their cumulative effect is striking. Picture F is of a house a little further along Northgate, with a wonderful display of creepers and climbing foliage.

The next six photos all figure All Saints Church in one way or another. Picture G is a photo taken from Northgate on a misty evening where all that can be seen of the tower is a small floodlight area. The thatched cottages on Northgate can be seen in the foreground. Picture H shows the spire of the church from the garden of the Wheatsheaf pub opposite on a pleasant summer afternoon. Picture I (from here) shows the Green Man stone capital within the church – one of a series of wonderful capital carvings I have blogged about elsewhere. Picture J shows a possible Anglo-Saxon Saxon cross built into the south porch of the church. The identification is very speculative, but the cross is very similar to other, demonstratively, Anglo-Saxon examples. Pictures K and L shows t wo views of the Castle Great Hall, Old School and Church, from Cutts Close and the Castle grounds. I have argued elsewhere that these might be an indication of an early church group in the area. Click on the pictures to see the full extent of the photographs.

Pictures M and N show two nice examples of ghost signs from Catmose Street and Mill Street – faded, painted signs indicating a former usages. Picture O shows the Old Drill Hall on Penn Street which is impressive despite looking as if it could do with a bit of TLC. Picture P, also on Penn Street shows row of houses with a pleasing skyline. South Street Railway Bridge (Picture Q) is hardly beautiful, but very functional ,offering a way over the railway for pedestrians old and young, cyclists, mobility scooters, prams, shopping trolleys etc. For obvious reasons it is know in my household as the “slow bridge”. Finally Picture R (from here) shows the chapel of St John and St Anne – a medieval foundation serving the sheltered housing around it. It is the only place I know where the minister presiding at communion can watch, through the west window, the tops of passenger and freight trains passing within a few yards of the outer wall.#

Further posts on aspects of Oakham can be found using the button below.

A memory of Dudley Sports Centre

Dudley Sports Centre was a large football and cricket ground of the Tipton Road in Dudley. I guess these days it would be called a multi-sports complex! A 1950s map is shown below. The football ground was to the south with the main stand backing onto the cricket ground, with the cricket ground to the north, with the Pavilion and terraces in front of the back of the football stands. There were playing fields to the north and the west. It dated from the 1880 but was much expanded in the 1930s when the football ground was opened. It was used by Dudley Cricket Club and Dudley Town FC. Over 16000 spectators attended Dudley Town’s first match in 1932. Worcestershire CCC used it as an out ground from 1911 to 1977 for first class and list A fixtures.

The Sports Centre in the 1950s

As a teenager, I watched games at the ground on many occasions – football matches between Dudley Town and my team, Brierley Hill Alliance, and a variety of other games including county cup finals; and cricket games when Worcestershire were in town. It is one of the latter that sticks most in my memory. This was the game between Worcestershire and Warwickshire on 5th September 1971, when I was 17. This was a 40 over John Player league game (in the days when it was felt acceptable for manufacturers of carcinogenic products to sponsor sports competitions). Worcestershire had had a good season and in this, their last game of the season, needed to win the match to have any chance of winning the league. As ever with cricket, the situation was complicated, and not only did they need the four points from the win, they needed to ensure that their run rate (runs / over) over the season was such that it surpassed that of Essex, the team below them. Even then they could not be sure of the title, as the third placed team, Lancashire had a game in hand, and played the following week. Lancashire had to lose that game, even if Worcestershire won on September 5th. I remember sitting on the terraces to the west of the Pavilion shown on the above figure. The TV cameras were in attendance, and my mother spent the entire afternoon watching a cricket match on BBC3 to see if she could see me in the crowd. Warwickshire batted first, and their scorecard is below. The only managed to make 126 – a very low score even in those pre-T20 days. Of the bowlers, Basil D’Oliveira, Vanburn Holder, the overseas signing for the year, and Brian Brain did most of the damage.

The Warwickshire Innings

Basil D’Oliveira, Vanburn Holder and Brian Brain

In the Innings break it was announced that, in order to achieve the required overall run rate for the season, Worcestershire needed to surpass that total in 17.5 overs – so the match became a T20 match 30 years before that concept was invented. I remember little of the innings other than its frantic nature. The scorecard is again given below. Nearly all of the runs were scored by three players – Ron Headley, the son on the West Indian batsman George, Basil D’Oliveira again and Alan Ormrod. Worcestershire made the required total with two balls to spare, resulting in raucous celebrations. Lancashire obligingly lost the match the following week, and Worcester were proclaimed as champions.

The Worcestershire Innings

Ron Headley, Basil D’Oliveira and Alan Ormrod

I went off to university a year after the match, and I don’t remember seeing any more cricket there. As is well known, the Sports Centre was shut in 1985 after a large hole appeared and part of the pitch disappeared into a limestone cavern beneath the site. Worcestershire never played there again, and Dudley CC, a long-term member of the Birmingham League, folded. Dudley Town have led a peripatetic existence ever since, playing at a number of grounds within and without the borough – the Round Oak stadium, the Dell stadium, Tividale and (currently) at Willenhall. The site is now the home of the Castle Gate complex.

The Sports Centre after closure

An election manifesto for Transport

Introduction

As the journalist Christian Wolmar has discussed in a recent article, the UK does not have any sort of agreed National Transport Policy that could be used as a rational way of developing transport infrastructure in a politically non-partisan way. Such a policy will certainly not emerge from the current government, and there is little to suppose that any future government will give priority to developing such a plan. Without it, transport policy is vulnerable to ill thought-out ad hoc initiatives and, as at present, in ad hoc cutbacks. In this post I will suggest a pragmatic way forward on this.

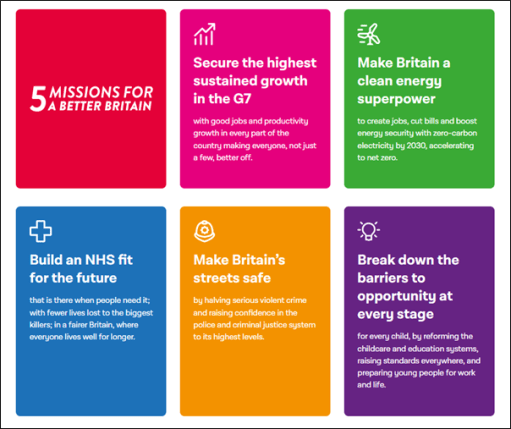
What I propose is based on the assumption that the next Government will be formed by the Labour Party, either as a majority party or with some sort of agreement with the Liberal Democrats. This is certainly what would be suggested by the opinion polls where at the time of writing Labour have a 22% lead over the conservatives. The Labour party has proposed five “missions” that will direct their approach to the 2024 elections and any subsequent government. None of these missions mentions transport at all, but there are transport issues embedded in each one of them. In what follows, I set out these missions, the transport issues that arise from them, potential policy objectives, and potential policy proposals. I then bring these proposals together to form a list of Transport policies that could be used, no doubt in a modified format, both for the next election and in any subsequent government.

Readers should not assume from this that I am a Labour Party supporter. I have never been a member of a political party, and never intend to be. Politically I am a centrist, but with somewhat radical environmental views, formed partly by my professional work as a Professor of Environmental Fluid Mechanics at the University of Birmingham (now retired). The proposals below are simply pragmatic – a possible way of influencing the next government to do something sensible in transport terms.

The Labour Part Missions

Mission 1

Secure the highest sustained growth in the G7, with good jobs and productivity growth in every part of the country making everyone, not just a few, better off.

Transport issues

  • Transport congestion on road and rail, for both people and products, leading to reduced productivity.
  • Poor workforce mobility, leading to inflexibility in employment locations.
  • DfT methodology for assessing CBR of transport infrastructure does not take proper account of induced flows on highways – i.e. new roads encourage traffic growth and can increase congestion.

Transport policy objectives

  • Revise DfT methodology for assessment of congestion reduction of new roads to include induced flow effects.
  • Infrastructure interventions to reduce road and rail congestion.
  • Encouragement of modal shift from road to rail, for both people and products.

Transport policy proposals

  • Revision of DfT methodology for assessing congestion reduction of new road schemes to include proper consideration of induced flow.
  • Small number of specific congestion-reducing road schemes (consistent with Mission 2).
  • Speed up development of rail enhancements and new build (HS2, EWR and NPR).

Mission 2

Make Britain a clean energy superpower to create jobs, cut bills and boost energy security with zero-carbon electricity by 2030, accelerating to net zero.

Transport issues

  • DfT methodology for assessment of contribution new transport schemes to carbon production and climate change has been shown to be flawed, particularly in relation to new roads.
  • UK Carbon based transport emissions levelling off or increasing.
  • Transport is now major carbon producing sector of economy.

Transport policy objectives

  • Reassessment of DfT methodology for assessing environmental impact and carbon production of new transport schemes.
  • Development and roll out low carbon technologies (electric and hydrogen vehicles, electric trains) including electric car recharging infrastructure.
  • Encouragement to use low carbon modes of transport and active travel modes.

Transport policy proposals

  • Revision of DfT methodology for assessing environmental impact of new road schemes to be revised.
  • Investment in electric and hydrogen vehicle research and production
  • Development of electric vehicle recharging infrastructure.
  • Electrification programme for railways
  • Fiscal incentives to encourage low carbon mode use.

Mission 3

Build an NHS fit for the future by reforming health and care services to speed up treatment, harnessing life sciences and technology to reduce preventable illness, and cutting health inequalities.

Transport issues

Transport policy objectives

  • Improve urban air quality through encouraging low emission vehicles.
  • Improve air quality through traffic reduction and modal shift to public transport.
  • Encourage active travel (cycling and walking).
  • Improve public transport (primarily bus) links to health care facilities,

Transport policy proposals

  • Fiscal incentives for ULEZs and LTNs.
  • Support for public transport
  • Fiscal incentives to local authorities to provide active travel infrastructure.

Mission 4

Make Britain’s streets safe by reforming the police and justice system, to prevent crime, tackle violence against women, and stop criminals getting away without punishment.

Transport issues

  • Safety issues due to high road speeds in urban areas.
  • Safety issues due to pavement parking.

Transport policy objectives

  • Make urban streets safe for pedestrians and cyclists.

Transport policy proposals

  • Fiscal incentives for LTNs.
  • Lower and enforce urban speed limits.
  • Enforce pavement parking laws.

Mission 5

Break down the barriers to opportunity at every stage, for every child, by reforming the childcare and education systems, raising standards everywhere, and preparing young people for work and life.

Transport issues

  • Poor access to childcare and education for those without cars (20% of households)

Transport policy objectives

  • Improve access to childcare and education for those without cars.

Transport policy proposals

  • Support for public transport
  • Fiscal incentives to local authorities to provide active travel infrastructure.

The policies

From the consideration of the individual missions, the following specific transport policies can be developed.

Policy 1

Revision of DfT methodologies for assessing new transport schemes to take proper account on induced flow and environmental effects. (Missions 1 and 2)

Policy 2

Invest in new transport infrastructure with a small number of congestion-relieving road schemes, electric car charging facilities, and major investment to rail infrastructure, including staged development of HS2, NPR and EWR) and a rolling programme of electrification. (Missions 1 and 2)

Policy 3

Support for public transport (trains and buses) for increasing employment opportunities and providing access to healthcare and education. (Missions 1, 3 and 5)

Policy 4

Reduction of urban speed limits and enforcement of pavement parking laws. (Mission 4)

Policy 5

Fiscal incentives and support to local authorities to encourage low carbon vehicles and modal transfer to low carbon modes; for the development of ULEZs and LTNs, and provision of active travel infrastructure. (Missions 2, 3 and 5)

Commentary

Policy 1 is not going to set any electoral debate alight, but it is quite crucial. In the past the DfT has used flawed policies to assess road building schemes against other transport schemes, knowing that they were flawed. This needs to change. Indeed, I would regard the DfT as no longer fit for purpose in many ways (as an example, its current handling of the railway network, the ongoing industrial action and major cutbacks to active travel budgets can be cited) and there is an argument for a complete re-organisation here to establish a wide ranging Department for Infrastructure that brings together transport, the utilities and construction. This would allow proper consideration to be given to the transport effects of new housing build (often built without public transport provision) and conversely the effect of a move to electric vehicles on the development of the electricity grid.

Policy 2 is wide ranging and expensive, and any specific proposals would need to be carefully phased in terms of expenditure. The basic point however is that high quality transport infrastructure for people and products is a fundamental requirement for a productive economy, the more so as the switch to the “green economy” proceeds.

Policy 3 is important for many, and in particular those on low incomes. The provision of a high-quality public transport network (particularly buses) that is comprehensive in its coverage would make access to employment, healthcare and education very much easier for many people.

Policy 4 is essentially aimed at public safety. It would no doubt be categorised as a “war on motorists” by sections of the press, but this is a battle that needs to be fought for the public good.

Policy 5 is another proposal that might be electorally contentious as (weirdly to my mind) LTNs, ULEZs and active travel have become very politicised. Fiscal incentives could be a way forward here, as proposed in the more detailed description of Mission 2 recently released by the Labour Party. This might include the possibility of both support for the initiatives and a wider reduction in rates for those Local Authorities that develop such schemes. This would be basically a bribe, and would need to be carefully costed and targeted, but could help in the establishment of such schemes. In terms of encouragement to use low carbon modes, a study should be initiated to look at how road pricing, aviation fuel duty and rail fares could be used to encourage the necessary modal shift.

The 292 bus route from Kidderminster to Ludlow – an important transport link?

292 at Kidderminster Bus Station in 2010

I have recently been on a short break to Cleobury Mortimer in Shropshire, travelling there by train and bus from where I live in Lichfield. The train journeys, from Lichfield to Birmingham and Birmingham to Kidderminster went very smoothly and were quite a pleasant experience. There were a number of route permutations, but we chose to walk between Birmingham New Street and Birmingham Moor Street, both on the way there and back. The bus leg from Kidderminster, on the Diamon bus 292 was rather less easy. The bus didn’t stop at Kidderminster railway station, with the nearest advertised stops (on Google and various websites) being 400m away in Oxford St. Arriving there however, we found this was not the case, with no mention of the 292 on the timetables at the stop, so we walked on to the bus station, another 400 yards away. There we eventually did get the bus, which was running over half an hour late. The journey itself was fine, and as we were in no hurry, the delay was of no particular concern to us.

Over the days that followed, I kept track of the buses on the 292 route between Kidderminster, Bewdley, Cleobury Mortimer and Ludlow, and it soon became clear that the lateness was endemic. The journey was timetabled for 50 to 55 minutes, with a two-hour frequency, with one bus shuttling backwards and forwards – see the timetable below – from https://bustimes.org/services/292-kidderminster-ludlow . This timing was simply too tight to ensure punctual running throughout the day. Whilst some of the delays came from congestion in the towns at either end of the route as might be expected, the most critical delays were due to parked cars on the A4117 between Bewdley and Ludlow requiring single file traffic through the towns and villages along the road. Such delays could of course be quite easily eliminated, given the political will.

Current 292 Timetable

Now service 292, currently operated by Diamond buses, is actually the truncated remains of a much longer Midland Red service with the same number, that ran from Birmingham to Kidderminster, Ludlow and Hereford. A time table for this service is shown below from 1991 for the Birmingham – Hereford direction – from http://midlandred.net/service/timetable/display.php?routeID=1007. The service was withdrawn, apart from the Kidderminster to Ludlow leg, in the early years of the current century. It can be seen at that time there was an hourly service between these two towns, rather than the current two hourly service. This represents a considerable degradation in service provision.

292 Timetable 1991

But the transport context has changed in many ways over the last few decades. The role of the long-distance bus has been largely taken over by trains, with a much greater frequency than 30 years ago. On the original 292 route there are now 4 trains an hour to Kidderminster from Stratford upon Avon through Birmingham, either terminating there or continuing to Worcester, and two from Worcester to Birmingham; at Ludlow there are two trains per hour in each direction between Manchester, Shrewsbury, Hereford and various destinations in south Wales. So in this sense, the truncation of the service was sensible and appropriate.  It now serves a purely local market for those who live on its route.  But I would argue, in any sane country that takes seriously the need to reduce carbon emissions and the need for modal change (i.e. not the one in which I reside), the Kidderminster to Ludlow route would be of some strategic importance. With improvements in frequency and connections with rail at Kidderminster and Ludlow, it would offer a route from the West Midlands conurbation, via  the Stour Valley line, into south Shropshire and the Marches, with major tourist potential. Further, if the route were combined with the hourly 52 from Kidderminster to Bromsgrove (and ultimately Redditch), it would offer connections from the south west at Bromsgrove into the same area, and also from the Cross City line that serves the north of Birmingham and the city centre. The 52 actually runs past both Bromsgrove and Kidderminster stations. Continuation of the service north of Ludlow to Craven Arms (in parallel with the railway) would offer connections to the Heart of Wales line, whose tourist potential has not been fully developed, and perhaps further to Welshpool for connections to the Cambrian line. All these possible connections are shown in the figure below.

But life is of course not that simple. For such a service to be a success other changes would be necessary. Firstly, efforts would be required to split the local markets in Ludlow and Kidderminster from the longer-distance markets to make overall journey times on through services as short as possible. There is no reason why this should not be possible but would require extra resources in terms of service provision to meet the requirements of the very local market. This mix of markets has been a major reason for the demise of long distance inter-urban buses in the past – perhaps most recently in the truncation of the Oxford to Cambridge X5 at Bedford, because the local market between Bedford and Cambridge resulted in significantly increased journey times.  Secondly, attention would need to be paid to the interchange points at either end of the route. For example, the bus stops of the Bromssgrove to Kidderminster route at Kidderminster Railway Station are on narrow pavements on a road bridge over the railway line – a very uninviting and inconvenient place for mode transfer. Attention would also o fcourse need to be paid to timetabling to ensure suitable connection times.

The other issue is of course more structural in that there is no overall transport policy in the UK that would facilitate such developments – see the recent blog by Christian Wolmar on this. And this lack of an overall policy means that resources cannot be channeled to such schemes, despite the fact that their benefits would be significant in terms of carbon emission reductions and stimulating local economies. It has always been thus as far as I can remember. I still want to believe that a competent government will one day realise that this is the road to take. But perhaps I am here opening myself up to a charge of naivety.

Reflections on “The whole world a Black Country” by Matt Stallard

This is an article published in the Spring 2023 edition of the Blackcountryman, reflecting on an article by Matt Stallard in the previous edition

In the last issue of the Blackcountryman, Matt Stallard described the rather bizarre way in which the Victorians saw the Black Country as a horrific paradigm of environmental devastation that was uncomfortably close to home, whilst at the same time extolling those places elsewhere in the Empire which had taken the same path of industrial exploitation and were described as local Black Countries. Reflecting on our own Black Country he writes

In world-historic terms the Black Country has a rightful and still-underappreciated place as foundational when it comes to the engineering and scientific breakthroughs and forms of knowledge that were later transported in the minds and bodies of people … throughout the world; Dud Dudley, Thomas Newcomen, Abraham Darby, John Wilkinson and all the others, names and unnamed….

A proud legacy indeed, and one that resulted in major benefits for humanity, in terms of health and quality of life, but one that needs to be balanced against how this knowledge was used to cause significant environmental damage in this country and around the world. After a thorough survey of the developments of the various Black Countries around the world, driven by the process of colonialism tinged with classism, eugenics and racism, he concludes with the following more optimistic words.

For our region, placing our proud and truly world changing history at the centre of the most critical debates of our time has the potential to put us on the map in a positive, constructive way – where we dismantle those tangled, toxic legacies and write our own twenty-first century narrative, and map out new futures for our, and the many other Black Countries they imagined across the planet.

As I reflected on this article, another thought struck me. If the role of the Black Country was indeed foundational in the engineering and science developments that enabled the extraction of large quantities of coal which in turn fueled the Industrial revolution, with its legacies both positive and negative, then it has to be admitted that the current climate crisis, caused by climate warming fuel due to the greenhouse gases that result from the use of fossil fuel, also has at least some of its roots in the Black Country. This is not in any way to apportion blame or to lay the responsibility for the current crisis on those who live there now – the effects of fossil fuel burning on the climate have only become apparent in the last fifty years, and many of the current inhabitants of the area are descended from those who were as thoroughly exploited by the rich and powerful landowners and financiers as those held in slavery in the colonies. But nonetheless, it is important to acknowledge that our region was instrumental in the causes of the present crisis.

Now, it is clear that unless urgent action is taken, then the effects of climate change will be felt in a major way around the world, even within the Black Country. Whilst we will not be affected by the inevitable sea level rise, which is already underway and will continue for many decades whether or not action is taken to reduce carbon emissions, many low-lying areas around the world are facing inundation by rising water levels. Some parts of this country are most definitely at risk – I would very strongly advice about buying houses in the Fenland for example with or without flood insurance! But the Black Country will suffer in two ways – by consistent higher temperatures in summer, exacerbated by the urban nature of the Black Country leading to an “urban heat island” effect, where temperatures will be several degrees higher than the surrounding areas; and by the greater weather instabilities that can be expected, with higher winds and rainfall, which will be magnified by the significant elevation of the Black Country above sea level. No one will be immune.

Nut to return to Matt Stallard’s final observation, in the light of this legacy, what is the new narrative that we could write, the new future that we can map out? It has to be admitted that here I write in hope rather than expectation, but there is a potentially positive future in view, where the Black Country becomes a paradigm for adopting measures to mitigate the future effects of climate change internationally. The region still has a major engineering and construction skills base, that could be utilized in the production and installation of green energy products such as wind turbines and solar panels. In the nineteenth century, the Black Country was exploited for its underground wealth – could it now be exploited, for its much more environmentally friendly surface and aerial wealth. As I noted above, the Black Country sits on the Midlands plateau, 150m above sea level – an ideal location for onshore wind turbines. Although such turbines are currently something of a political hot potato, they do offer the prospect of significant amount of green energy. Similarly, there seems to me no reason why the huge stock of low-rise housing across the region should not be fitted with solar panels, and thus become a large-scale solar farm. Wind and solar energy are of course not continuous, and some sort of balancing energy source is required. The most efficient, and indeed most environmentally friendly, is the use of pumped storage – pumping from a low-level reservoir when energy is available and releasing the water to a lower level through turbines to produce energy at times of peak demand. Again, the topography of the Black Country is ideal for small scale pump storage schemes, with rapid drops to lower levels at the edge of the plateau – the long flights of locks on the Wolverhampton, Stourbridge and Dudley canals testify to this fact.

In addition to becoming a paradigm for green energy production, the Black Country need to do something about its direct production of greenhouse gasses – through insulation of the building stock to decrease energy use, and through a move away from carbon fuel-based transport to transport powered by renewable means (usually through electricity) of through active travel – cycling and walking. Indeed, across the UK the transport sector is a major issue in terms of carbon emissions, being the one sector where carbon production is still increasing. This presents a major challenge to the Black Country, which is very much the centre of a car dependent culture. The development of the Midland Metro and light rail schemes, and the roll out of electric buses and electrically assisted cycles and proper cycle infrastructure, are hugely important in this regard. A move away from car-based transport would also have a major effect on more local environmental and medical issues such as poor air quality due to transport emissions (which is estimated to kill between 28000 and 36000 people each year nationally) and obesity due to the lack of exercise.

So, I would suggest it is possible to map out a future for the Black Country that acknowledges that at least to some extent, the issues over climate can be traced back directly to engineering and scientific developments in the region but positions itself as a region where its skills can be used to develop new methods for solving the issue. A fanciful, optimistic vision? Maybe, but perhaps one that is worth holding on to.

Measurements of Carbon Dioxide concentrations in a church

The measurements reported in this post were made by colleagues of the School of Engineering at the University of Birmingham – Dr David Soper and Dr Mike Jesson – whose help is gratefully acknowledged.

Introduction

Over the course of the Covid-19 pandemic, there has understandably been increased concern over ventilation within buildings and on buses and trains etc. This has been reflected in church circles where church ventilation has also been much discussed. Whilst more modern churches will have been specifically designed with ventilation in mind, with proper ventilation paths between windows and doors, the same cannot be said about older churches. For many such churches the only ventilation is offered by the opening of doors, and by leakage through windows and roofs. Because of the large vertical size of such buildings, this lack of ventilation is ameliorated by the ability of any pollutants of pathogens to diffuse throughout the large church space.

One such church is St. Michael on Greenhill in Lichfield (figure 1 below), which is essentially two large, connected boxes – a nave, and a chancel, with a main door in the north wall of the nave and a smaller door into the choir vestry on the south side, and internal doors between the vestry area, the nave and the chancel (figure 2). A though ventilation path is rarely established however as the external and internal doors are seldom open at the same time. There are plans to build new parish rooms to the south of the church, on the grassed area of the figure below.

Figure 2. Plan of church (the measurement positions are indicated by red circles)

This brief post outlines a short series of measurements to measure carbon dioxide (CO2) levels in St. Michael’s. CO2 is produced naturally by people during breathing and CO2 concentration levels are often taken to be an indication of pathogen levels when the population is infected. These measurements were made on Sunday May 15th 2022, when the service pattern was somewhat different from normal, with the normal 8.00 and 10.00 Holy Communion services supplemented by the Annual Parochial Church Meeting (APCM) at 11.15 and a 4.00 service at which a new Rector was Instituted by the Bishop and Archdeacon. As such it gave the opportunity to look at the effects of different congregation numbers (10 in the chancel for the 8.00 service, 50 for the 10.00 service and the APCM, and 150 for the Institution). A screen shot of a video of the Induction service is shown in figure 3 to give some idea of the density of the congregation.

Figure 3. The congregation during the 4.00 service

The measurements

Carbon Dioxide measurements were made with small transducers and data loggers at different points around the church. These were attached to pillars of left on suitable window ledges. These sampled automatically every minute and the results were transmitted wirelessly to a Raspberry Pi computer and from there to a University of Birmingham web site from where the data could be accessed in real time. These measurements were supplemented by measurements of temperature and pressure using further transducers with built in data loggers.

For the sake of simplicity only the results from two of the CO2 sensors will be shown, as the results from them all were very similar. The location of these are shown on the plan of Figure 2 – one on a pillar in the nave, and one on a window ledge in the chancel. The photographs of the instruments shown in figure 4 indicate that they are quite small and discrete and indeed were barely noticed by the congregation. The results will be presented from midnight on Saturday May 14th to midnight on Sunday May 15th.

The results of the trials

The weather on May 15th was quite pleasant with early morning temperatures of 10°C rising to around 20°C in the late afternoon and evening. The external humidity varied from 20% to 100% throughout the day. Inside the church however there was far less variation with temperatures between 16 and 21°C and humidity between 55 and 70%. The was a light southerly wind in the morning, with a somewhat stronger easterly wind from mid-afternoon onwards.

The results of the CO2 measurements are shown on the graph of figure 5. These are shown in terms of parts per million (ppm) of carbon dioxide in the atmosphere by volume and are relative to a general background level of around 400 ppm.

Figure 5. The carbon dioxide concentration measurements

The church was opened at around 7.30 am for the 8.00 Holy Communion service held in the chancel, which went on until till around 8.45. Around 10 people attended. There can be seen to be a small increase in CO2 levels in the chancel over the course of the service (A). Later in the morning there was a 10.00 Holy communion service in the nave with around 50 in the congregation, with a small choir of 4 or 5 in the chancel. This was followed immediately by the APCM from 11.15 to 11.45 in the nave with about the same number attending. During this period there can be seen to be a steady increase in CO2 levels both in the nave and the chancel (B). At 12.00 the church emptied and the doors were closed. This led to a steady decrease in concentrations (C) till about 2.00 when people started to arrive at the church to set up for the major service of the day – the Institution of the new Rector by the Bishop of Lichfield. At this point both the main door and the choir vestry door were opened (as Gazebos were being set up to the south of the church for refreshments after the service), and a ventilation path was opened through the church, with major CO2 concentration reductions (D). Around 3.00 the congregation for the 4.00 Induction service began to arrive and the church rapidly filled with around 150 attending, including a choir of around 20 in the chancel. There were significant increases in CO2 concentrations during the course off the service through till around 5.30 (E). When the service was over, both the main door and the choir vestry door were again opened, and there was a rapid drop in concentration levels till around 7.00 when the choir vestry door was closed (F). After some clearing up, the church emptied by around 8.00 and there was a gradual fall off in concentration levels (G).

Two main points emerge from these measurements. Firstly, and quite obviously, the levels of CO2 increase with the number of people in church and with the time they spend there – B and E on the above figure. Secondly it is clear that there are two different types of ventilation – the slow diffusion of CO2 throughout the building and leakage through the building envelope – roof, doors, windows etc. (C and G); and the rapid lowering of concentration levels when there is a direct ventilation path through the building between the two doors (D and F).

Now from the slope of the graph for the times when concentrations are falling, it is possible to get estimates of the time it takes for the concentrations to fall by 50%. For C and G these times are around 2.5 hours, whilst for D and F these times are between 10 and 30 minutes. Thus the through ventilation reduces the carbon dioxide levels much more quickly than simple diffusion and leakage.

Implications

The results show firstly that the method that was used is a simple and viable way of assessing the main ventilation parameters in a church. Colleagues from the University of Birmingham recognise that there is still work to on improving the frequency response of the sensors but overall the method has much promise. Secondly there are some implications for St. Michael’s itself – that large congregations in the church for lengthy periods of time can result in significant CO2 concentrations (and thus pathogens in times of infection), and that through ventilation is much more effective in reducing these concentrations than simply relying on diffusion and leakage. In the Parish Rooms developments that are under consideration for the area adjoining the choir vestry, it may be worth investigating if it is possible to design through ventilation paths through the church and the new development.

Train services on the Ffestiniog and Welsh Highland Railways

The March / April 2022 service pattern

There are ongoing discussions, which at times are becoming quite heated, within the wider Ffestiniog / Welsh Highland Railway community about the nature of the services planned in this post pandemic period. On the one hand, the company sees the need to maximise train loadings and thus reduce the unit costs, to cope with huge increases in fuel and staff costs. This leads logically to the need to continue the successful pandemic style timetable of booked tours – from Porthmadoc to Tan–y-Bwlch / Blaenau Ffestiniog / Beddgelert / Caernarfon and back, with one train journey being filled before another is timetabled, and with no intermediate stops. The service pattern for late March 2022 shown above reflects this and consists of a number of named and themed trains. Without a doubt this meets the needs of most passengers, who are not necessarily railway enthusiasts, but simply want a good day our for them and their family, and is cost effective in that trains are maximally loaded. On the other hand, there is a strong, and as I perceive, growing, feeling amongst Ffestiniog and Welsh Highland Society members and supporters that a more normal scheduled timetable with intermediate stops should be reinstated, to restore the railways to what are perceived as their true selves as service providers. I have sympathy with both points of view – the financial challenges are certainly significant and need to be addressed, but the provision of specific tours simply does not meet the needs and aspiration of many. This includes myself, as I nearly always use the railway for journeys to intermediate stops, with walks of varying length between stations and “tours” hold no attraction at all for me. As things stand I, along with others, have no real reason to travel on the railways. As I write there are, I understand, proposals are being worked on to reinstate intermediate stops on some journeys, although it is not clear if this will approach anything like a regular service pattern.

The purpose of this post is to raise just one issue that is of potential significance. Last year I had the privilege of being an examiner for a University of Birmingham PhD thesis by Robin Coombs entitled “The sustainability of heritage railways”. I quote from the thesis abstract.

………In particular, the thesis explores the necessary condition(s) for the successful operation of a heritage railway in terms of governing their sustainability as expressed through consideration of their life cycle trajectory around the three pillars of sustainability – environmental, economic and social. The hypothesis proposed in the study is that good governance of railway assets and management is the key determinate of the sustainability of a heritage railway. This hypothesis was tested through a survey of 39 Directors and General Managers and 252 heritage railway enthusiasts of 104 heritage railways, semi-structured interviews with 15 Directors and General Managers, and the author’s recorded field observations and participation in 52 heritage railway visits and events. The research shows that the longevity of heritage railways does not simply arise from ‘good governance’ but is in fact the product of multiple interlinked variables and processes. Indeed, many heritage railways have survived and prospered despite poor governance, rather than because of ‘good governance’. One of the most significant of these explanatory variables is social capital, a hitherto under-researched governance variable in heritage railway studies. Through case study examples, social capital is demonstrated to have compensated and mitigated for failures of organisational governance and weaknesses in operational conditions on heritage railways. In this respect, heritage railways are argued to be similar to charitable and other public-good organisations. On this basis the hypothesis was rejected, and an alternative hypothesis proposed: that social capital (of which philanthropy, reciprocity and trust are key constituents) is a key determinant of the sustainability of heritage railways.

Robin makes a very strong case for the importance of what he calls social capital in the long-term sustainability of heritage railways – supporters contributing financially and materially and through voluntary activities. To my mind this is of very great importance in the current Ffestiniog and Welsh Highland context. A robust approach to income and expenditure through a business plan is certainly required in these financially constrained times, but if in doing so the relationship with volunteers and supporters is fractured, through the provision of a service pattern that does not meet their needs or their aspirations for the railways, this could potentially have a serious effect on the provision of social capital and thus on the long-term future of the railways, as supporters direct their time, efforts and money elsewhere. This simple fact should not be forgotten as future service provision is considered. I would thus suggest that conserving and expanding the social capital that the railways have built up over the decades is as important for the future of the railways as a financially robust business plan.

Robin’s thesis will in due course appear on the University of Birmingham’s ethesis web site at https://etheses.bham.ac.uk/ . In the meantime he can be heard describing his work in this podcast.

Football leagues – development sides and lower divisions

From time to time, the coaches of Premiership football clubs call for their development teams (usually for under 23s with a limited number of older players) to be allowed to play in the Championship or League 1 to give them more competitive games. Such proposals are usually strongly resisted by the lower leagues, as an attack in the integrity of their divisions. In this short post, I will try to show that league competitions can be constructed in a way that allows for the needs of the higher league Development teams and yet retains the integrity of the lower league competition and perhaps even enhances it. The method outlined is not just applicable to the football Premiership and Championship, but could be applied to other sports at all levels where there is a similar of “second” trams playing those in lower leagues.

Suppose we have 20 higher division developmemt teams and 24 lower division teams (the current numbers in the Premiership and Championship). We divide each group into two – HD1 and HD2 for the higher division development teams (10 in each group) and L1 and L2 for the lower league teams (12 in each group). The teams would play each other as follows.

  • L1 teams would play all the other L1 teams home and way (22 matches), the L2 teams once, half home and half away (12 games) and the HD1 teams once at home (10 games), giving 44 games in total (27 home, 17 away).
  • L2 teams would play all the other L2 teams home and way (22 matches), the L1 teams once, half home and half away (12 games) and the HD2 teams once at home (10 games), giving 44 games in total (27 home, 17 away).
  • HD1 teams would play all the other HD1 teams once, half home and half away (9 games) and the L1 teams once way (12 games), giving 21 games in total (4/5 home, 17/16 away).
  • HD2 teams would play all the other HD2 teams once, half home and half away (9 games) and the L2 teams once away (12 games), giving 21 games in total (4/5 home, 17/16 away).
  • L1 and L2 teams would be ranked separately on the basis of all games played, with the winners of each playing for the L title of that division. Both would be automatically promoted to  the league above, with the second and third place teams in each section playing off for other promotion places.
  • HD1 and HD2 teams would be ranked separately on the basis of all games played, with the winners of each playing for the title of the HD section of that division .

This format thus ensures the following.

  • The lower league teams and the development teams of the higher league teams would be ranked in separate divisions, even though there is some cross over on the teams that are played.
  • All teams would be ranked only alongside those teams that have played the same opponents the same number of times, ensuring integrity of competition.
  • The lower leagues teams would play a similar number of games to those that would be played in a conventional competition (44 as against 46), but with an increased number of potentially attractive home games against the higher league development teams.
  • The higher league development teams would play a significantly smaller number of games than the lower league teams, which conforms with current practice for such sides (for example on the Premier 2 league, teams play around 14 to 15 games in a season). All the games they play against the lower league sides can be expected to be very competitive.

The World Test Championship

The cricket World Test Championship is perhaps one of the most impenetrable of all sports competitions, with playing regulations and points coring systems that are not all easily understood by any except those who devised it and those with advanced statistical training. Details can be found here for those interested. The result of this complexity is to make it poorly understood by media and public, and it does little to generate interest (and perhaps financial sponsorship) for the test match format. But it needn’t actually be so. In this short post I describe a simple format for a World Test Championship that would be easily understandable; would result in meaningful matches and series; and would produce an undisputed champion every year. There is a snowball in hells chance of anything this sensible being implemented by the ICC, but its formulation has proved to be intellectually satisfying at any rate.

The basic principle would be to divide test playing countries into divisions of three. Based on current rankings (January 2022) these would be

  • Division 1 – India, New Zealand, Australia
  • Division 2 – England, Pakistan, South Africa
  • Division 3 – Sri Lanka, West Indies, Bangladesh
  • Division 4 – Zimbabwe, Ireland, Afghanistan

Given the current political climate Afghanistan’s position in Division 4 might be untenable, and it might need to be replace by another side (perhaps Netherlands or Scotland).

The basic principle would be that the sides in each division each year would play each other in a three-match series – one home series and one away series. The position in the division would be determined by giving 2 points for a series win and one point for a draw, or, if these points are equal, on the number of matches won. The top side in each division would either be declared world champion for the year, or be promoted to the next division, whilst the bottom side would be relegated. It would be no more complicated than that.

Essentially this would give a baseline for the number of test matches per year of six per team, which ought to be achievable. It does not preclude other series (such as the Ashes) being played as required – and indeed the world championship games could be designated tests in, say, a five-match series.  Each team would play different teams in succeeding years, apart from the top two in Division 1 and the bottom two in Division 4.

 The main requirement would be a need for flexibility in arranging fixtures on an annual basis, rather than as part of the longer-term future tours programme. This may be easier if designated periods were kept free from other series. The real advantage of such a method would be that it would greatly increase the profile of the long form game, with each of the series that are played being meaningful in terms of promotion and relegation, and gives the possibility of the championship finding a significant sponsor.

A new rail connection for Blaenau Ffestiniog?

In a 2019 issue of the Ffestiniog Railway Society magazine, a brief article described the early days of a project to restore the Dinas branch at the Blaenau Ffestiniog end of the line, thus reconnecting the town centre with the area in the midst of the slate heaps to the south of the Conwy Valley line tunnel (see the above map from Wikipedia which shows the complex FR layout around Blaenau). A useful history of the branch is give here.  It was lifted in the 1950s but the trackbed remains visible and accessible to the west of the Conwy Valley line south of the Ffestiniog tunnel. The main driver for the project would have been to provide a connection between the town centre station and the Llechwedd quarry, to the east of the Conwy Valley line near the tunnel portal, which has become a major tourist attraction, both in terms of its mining heritage but also as a mountain cycling and zip line venue. Unfortunately, with the advent of the pandemic, this project seems to have dropped from view, which is hardly surprising. The idea was raised recently once again on the Ffestiniog & Welsh Highland Railways Insider Facebook page, and the large potential costs of re-opening the branch against the potential income was again emphasized as the main barrier to taking this idea further.

Whilst I quite understand why the project has not progressed, it still seems to me that the initial reason for the proposed re-opening still remains. The centre of Blaenau has been transformed in recent years, but it is still an area that requires much investment in its future. To have its major tourist attraction an inconvenient mile and a half out of town with no public transport links, does little to help with the development of the town itself – indeed visitors to Llechwedd have no real need to stop off in the town centre at all. And of course the lack of any public transport connection simply encourages what is being increasingly appreciated as the unsustainable use of the private car. Thus in this brief post I suggest a way in which this project could be taken forward in what might be an affordable fashion (although I present no sort of cost benefit analysis at all).

The basic idea is simple – instead of relaying the former Dinas branch, the existing track formation of the Conwy Valley line should be used instead. With the current level of service provision on the line, in normal times the section from Roman Bridge just north of the  tunnel is occupied for only 45 minutes every 3 hour period. With a little imagination in the development of a signaling system to ensure safety, I would suggest that the line between the town centre and Dinas could be used for a shuttle service to take visitors between the town centre and the quarry complex when that section of track is not occupied. This could be done in two, relatively cheap, ways – either through the use of (lung destroying) standard gauge heritage DMUs, between the Conwy Valley line platform and a new platform at Dinas (which could be positioned on the eastern, Llechwedd side of the track and would avoid the need for a foot crossing that would be inherent in the relaying of the FR Dinas branch) and an access road to the quarry. More interestingly, a narrow-gauge track could be laid within the standard gauge track, with switches to allow narrow gauge trains to access these rails from the FT station, and a short station branch at Dinas. This would of course allow existing FR stock to be used.

Both these alternatives should be much cheaper than the relaying of the branch and could provide an attractive link between town and quarry. Realistically however they are likely to meet with strong opposition from the very conservative Network Rail culture, with its massively inflated approvals procedure, and great determination would be required to take forward these or other similar ideas.

At some stage in the future, I will write another blog post on the development of public transport links within the World Heritage Slate Landscape region – there is much to be said about transforming the current private vehicle dominated system into something that could be accessed by public transport. But that is for another day / week / month / year.