Lichfield’s first station master

In this post I will consider the life and career of Lichfield’s first Station Master, William John Durrad (1817-1889). All the information in this post is gleaned from public sources – registers of birth and death, census records, employment records and the local press. Whilst these can describe a life in broad terms, they cannot really give a proper picture of the person’s character and personality. But in the case of William Durrad, they do show a typical Victorian progression from humble origins to gentleman status, brought about through a mixture of patronage and effort, and cast some light on the life of Lichfield in the nineteenth century.

For the sake of readability, I have not given any sources of information in the text below – should readers be interested in where the detail comes from, please email me on bakercj54@gmail.com for further information.

Early years

William John Durrad was born in 1817, the second child John and Ann Durrad of the village of Welford in Northamptonshire and baptised in the parish church. To avoid confusion with others, I will generally refer to him as William John in what follows. The Durrad name has a long history in that area, with a John Durrad of the nearby village of Misterton (d1726), being part owner of the Lordship of the Manor and a considerable donor to local charities.  William John’s father, John (b1780), however seems to have been of humbler stock and is described at William John’s baptism as a weaver. William John had one elder sister and four younger brothers, at least two of whom died in childhood. Their relative lack of prosperity can be judged by the fact that in 1851 his elder sister Mary was a servant at a household in Lancashire and his younger brother Richard was a butler at a house in Surrey (where he was later to marry the cook). His father John died in 1826, and William John’s mother Ann married again in 1827 to William Sanders, an agricultural labourer, and had several other children. We will meet one of these, Stephen Sanders (b.1831), again in what follows.

William John next firmly appears in the historical record as an employee of the London North Western Railway in the mid-1840s. It is possible however, at least provisionally and with some conjecture, to piece together some aspects of his early life. The first clue comes from his obituary in the Lichfield Mercury in 1889 where we read

“Being brought into intimate relations with the late Archdeacon Moore, he was fortunate enough to secure the good wishes and kindly offices of that dignitary of the church, and by his influence obtained a situation under the London and North Western Railway Company in the early days of railway enterprise”.

The Venerable Henry Moore (1795 – 1876) was Archdeacon of Stafford from 1856 to his death in 1876. He was born at Sherborne, educated at Trinity College, Cambridge and ordained in 1819. In the 1840s he was vicar of Eccleshall near Stafford and Penn near Wolverhampton and was made Archdeacon of Stafford and Prebend of Handsacre in 1851. The pictures below show the sketch by the artists Henry Armistead for this effigy in the cathedral, and the finished monument.

The second clue comes from the rather unusual name of Durrad. From as early as 1839 to the end of the century and beyond, there was a store in Eccleshall trading under the name, firstly, of William Durrad, and later of Joseph Durrad. The early mentions of this firm in the press in 1839 were as an agent for the selling of “Woolriches Improved Diuretic Horse Balls”, “Simpson’s new antibillious pills” and “Wesley’s Family Pills”, but from 1841 it is referred to as “Stationers” and from 1844 onwards as “Booksellers”. The firm acted as a publisher of postcards and political pamphlets, and as the local agent for many weekly subscribing magazines. One of these pamphlet from 1847, “A Political Sketch of the Relative Position of England and France” by Herbert Rice Esq. can be read on Google books by anyone interested in that sort of thing.  A photograph of the shop from 1897 can be found here.

The 1861 census identifies the owner of the bookstore as William Durrad, born in Leicester in 1821, and described as “Painter and Bookseller, organist, distributor of stamps”. This younger William was the son of a James Durrad, born in Welford in 1798. It seems very likely, given that they were both born in Welford, that James Durrad was related in some way or other to the William John’s father John, possible a younger brother or nephew. Note William’s age however – in 1839, when we first hear of the firm, he would only have been 18 years old.  Unfortunately, none of the sources give a middle name that can be used to identify him more precisely, and we will refer to him as the younger William in what follows. There is however a tantalising reference to W. J. Durrad from 1843 in a press advert for  Wesley’s famous product.

The third and final clue is that in the London North Western Railway records, William John’s profession before entering the service of the company is given as “bookseller”.

Thus, we can conclude that in the early 1840s William John and the younger William, who were probably cousins, were owners of a bookshop in Eccleshall, with William John, at least at first, being the senior partner. It is likely that the W. J. Durrad mentioned above from 1843 refers to him. It was there that they met Henry Moore, then the vicar of the parish, who could be expected, given his background, to be something of a bibliophile. From that meeting, the influence of the clergyman was enough to find William John a position in the London and North Western Railway. The bookshop was presumably left in the hands of the younger William and was eventually taken over by his younger brother Joseph (b1838) in the 1860s, after Joseph had worked as an assistant in a bookshop in Leicester, when the younger William retired.

Of course this leaves the question unanswered as to how William John came to be in Eccleshall in the first place, where he obtained the education that was presumably required to operate as a bookseller, and how he obtained the necessary resources to open a shop at all. It is unlikely that these questions will ever be answered.

Station Master and family man

We first read of William John in the London North Western Railway records as being, in 1845, the Lichfield agent for the company. As the company wasn’t in existence until July 1846, he was presumably an agent for one of the companies that ultimately came together to make up the LNWR – probably the Trent Valley Railway. His duties were thus to represent the interests of the railway during its inception phase. He was paid either £100pa or £130pa – the sources are contradictory. By the time the station opened in 1847, he was the designated Station Master, on a salary of £120pa. He was also at that stage a married man, having married Elizabeth Lowe, at Tettenhall in April 1846. There is no indication of how or where they met.

The employment records note that William John joined the railway when he was 21, which seems like an error, as that would be in 1838, 5 years before parliamentary approval was given for its construction, and too early for the bookshop to be left in the hands of the younger William. However, his obituary of 1889 says that, before coming to Lichfield, thanks to the good offices of the Archdeacon, he worked for some time at Edge Hill station in Liverpool. This had been in existence since 1831 as part of the Liverpool and Manchester Railway. It is just about possible, given the constraints on his timeline, that he worked there in 1844 or 1845 before moving to Lichfield. However, there is another possibility. In the LNWR records we find reference in the mid-1840s to Stephen Sanders, William John’s half-brother, calling himself Stephen Sanders Durrad, as being employed at Lichfield under William John’s supervision and later at Edge Hill as a clerk. This might possibly be the cause of the confusion.

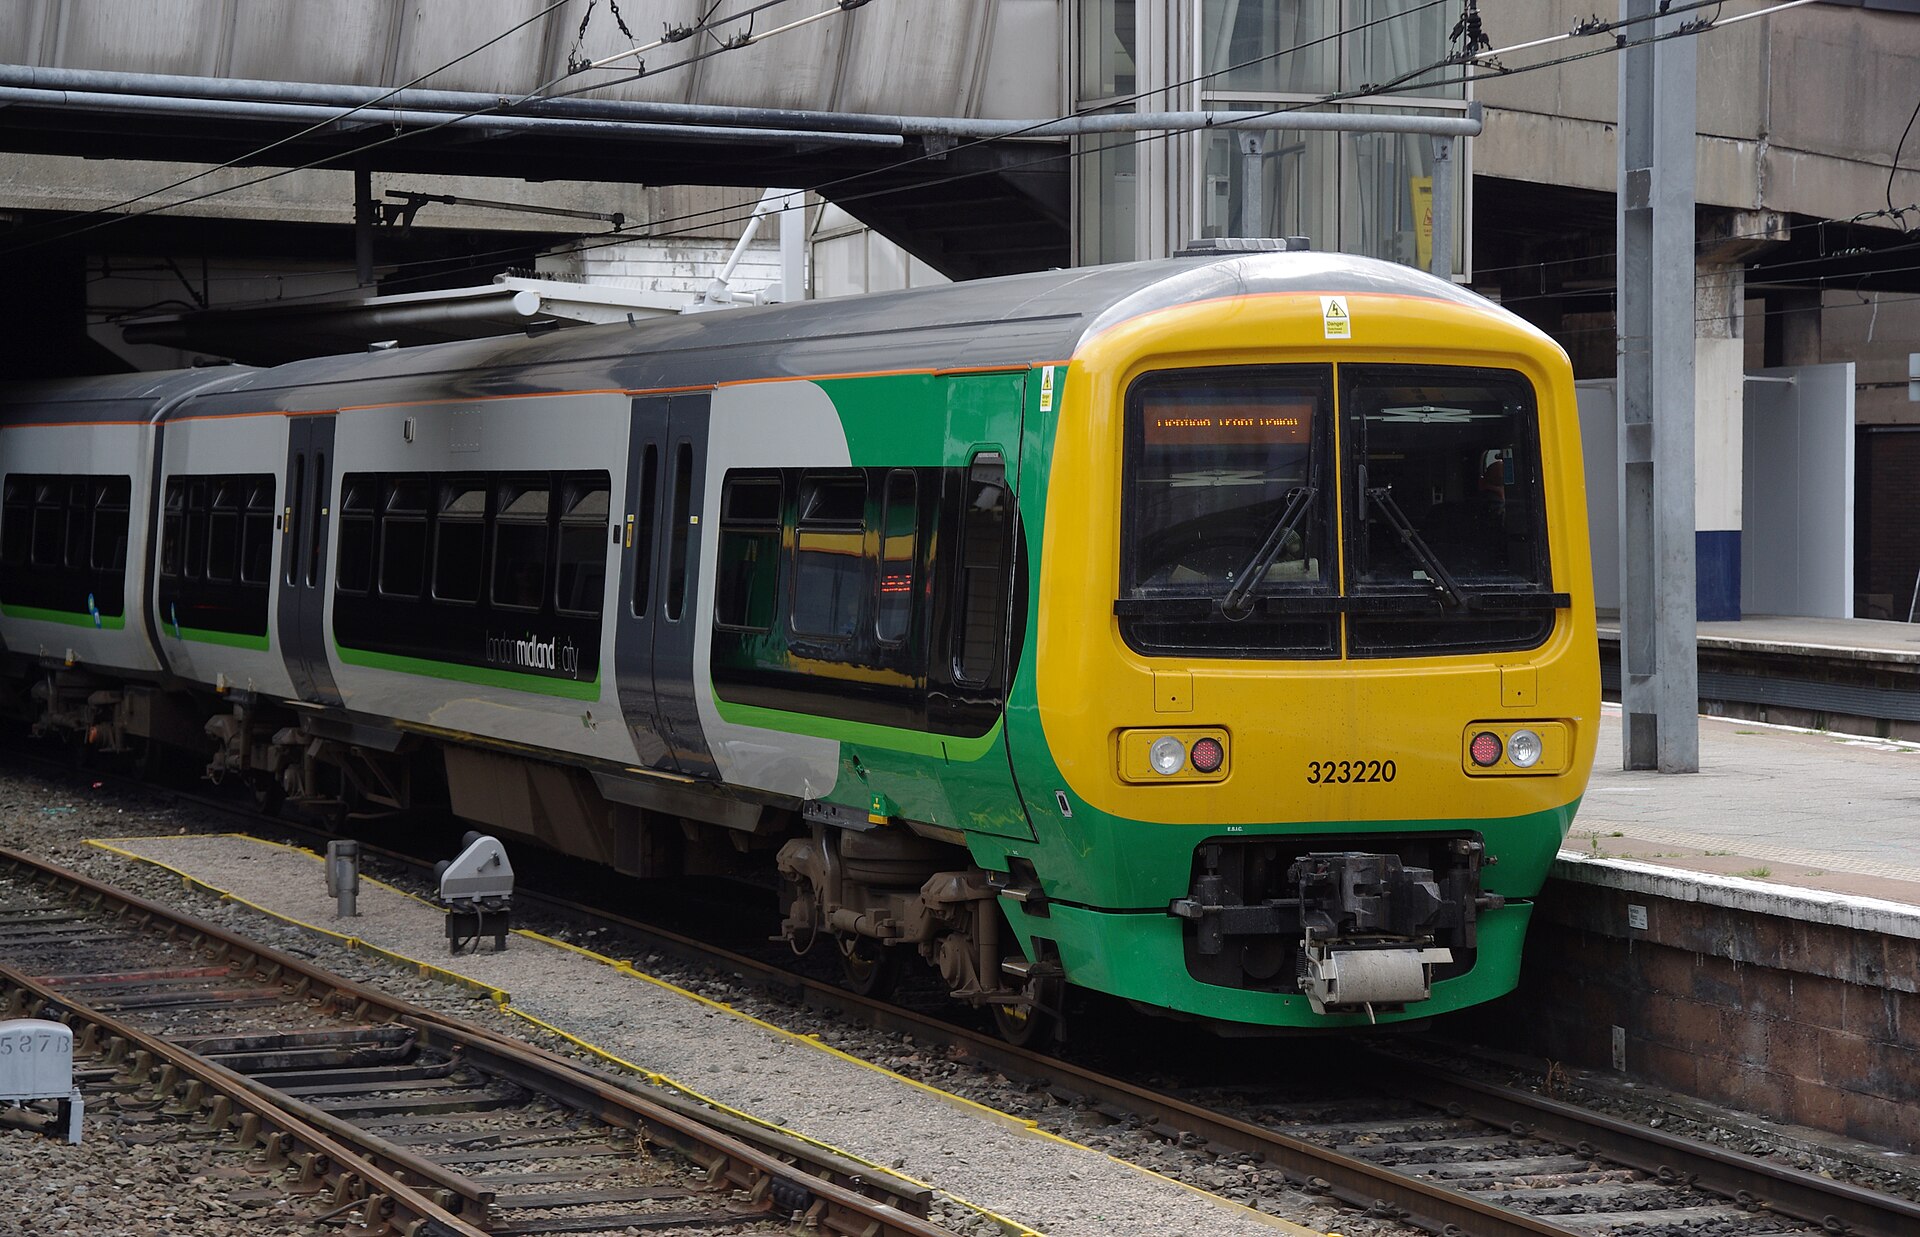
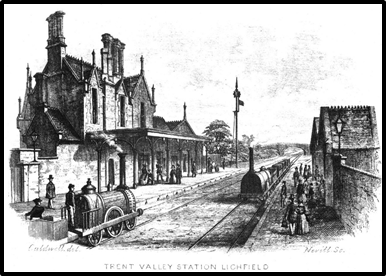
I have described the original Lichfield station in another post. Basically, it was situated on the west side of the Lichfield / Burton road which the railway crossed on the level, i.e. on the opposite side to the current station. The picture below shows the rather grand style that was adopted by the architect John William Livock. The station building contained not only the passenger facilities and offices, but was also the Station Manager’s House, for which William John paid £15 a year in rent. To the east of the station and the Burton road, from 1849 the railway was crossed by the South Staffordshire Railway (now the Cross City line). This had a station to the north of the crossover entitled Lichfield Trent Valley junction. The South Staffs Railway was leased to the LNWR in 1861 and absorbed into the company in 1867. Clearly having two stations was inconvenient for passengers and both stations were closed in 1871 and a new station, with low level and high-level platforms, opened at its present site.

William John was the Station Master for the entire life of the original Lichfield station, with a wide range of responsibilities for the passenger and freight traffic, and for a significant number of staff. It is difficult to be precise about staff numbers as only the clerks and the porters tend to be mentioned in the records, when in reality there would have been a range of others associated with the adjacent freight yard that William probably had some responsibility for.  That being said, in 1847 there were seven named staff – Stephen Sanders Durrad mentioned above in a temporary post, plus six porters.

William John’s and Elizabeth’s children were born at regular intervals over the first decade and a half of his tenure as Station Master, and all were baptised at St Michael’s church, the station being situated in Streethay, a township at the northern end of the parish. William Henry was born in 1848, Arthur James in 1850 (confusingly named as Alfred on the census return of 1851), Walter Richard in 1852, Emma Helen in 1853 and Bertram George in 1860. With them in the house there were a succession of young servant girls which indicates that the family were comfortably off. William John’s salary steadily increased – to £130pa in 1853 and £135pa in 1859.

From time to time we see mentions of him in the press. In 1855 he was a witness in the trial of William Marson, who was charged with stealing two trusses and a large quantity of cloth from a wagon that had arrived from Stafford last in the evening and not unloaded till the day after. This is interesting in indicating his responsibility for the goods traffic as well as the passenger traffic. In 1869 he was a witness at an inquest into the death of Charles Lees from Barton-under-Needwood, a goods brakeman for the LNWR, who was working on a train from Wychnor to Shrewbury. At Lichfield it was engaged in shunting activities to leave some wagons behind and pick up some others. This involved moving trucks down the rather steep incline from the old South Staffs station to the Rugeley sidings at low level. Acting very much against the company rule Lees uncoupled the wagons as they rolled down the incline, fell and his leg was crushed by the following wagons. His wounds were bound up as far as possible, and then William John decided to have him taken by train to Stafford, as this was the quickest way to get medical attention. However, he died of his injuries, although the inquest jury agreed that Durrad’s actions had been appropriate.

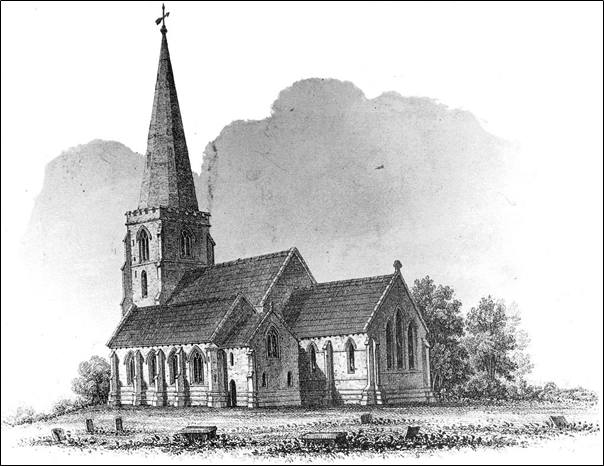
It has been mentioned that all William John’s children were baptised at St Michael’s parish church, and his obituary specifically mentions his ongoing involvement with the activities there.  A picture of the church after the ill-fated restoration of the 1840s is shown below. He was a Churchwarden there in the 1850s. The registers of the parish reveal a rather curious incident in 1869. Emma Helen Durrad, then aged 16, was recorded as having been baptised as an adult at a private ceremony, and this was entered in the registers. The incumbent at the time, James Sergeantson, must have been aware from a register entry of 16 years before by his predecessor Thomas Gnossall Parr that she had already been baptised as an infant, and thus this was certainly in breach of canon law. Why and where the baptism took place, and why Sergeantson agreed to enter it into the register is not clear. Perhaps she had become involved with a non-conformist body that insisted on adult baptism, and the parents were trying to regularise this and perhaps put the Rector under some pressure to make an entry in the register?

William John Durrad resigned from his post as Station Master in June 1871, by which time his salary was £150pa. Why is not at all clear – but perhaps the fact that he would be required to move into less palatial accommodation when the new station was built may have been a factor.  There was a collection for a testimonial in the town, announced in the press, that raised a considerable (but not specified) sum. In the census of April 1871 all his children were still living at home. William Henry (22) was cashier at Lloyds Bank in Rugeley ; Athur James (20) was an undergraduate at Jesus College, Cambridge (and presumably on vacation), Walter Richard (19) was also a bank clerk; whilst Emma Helen (17) and Bertram George (11) were identified as scholars. Both Arthur and Bertram attended Lichfield Grammar School and Loughborough School – and this may well have been the case for William and Walter too. William John’s brother Richard also lived close by – he and the cook he married when he was a butler in Surrey were now running an Inn in Rugeley – and when he died in 1874, William Henry was to act as one of Richard’s executors.

A Civic Official

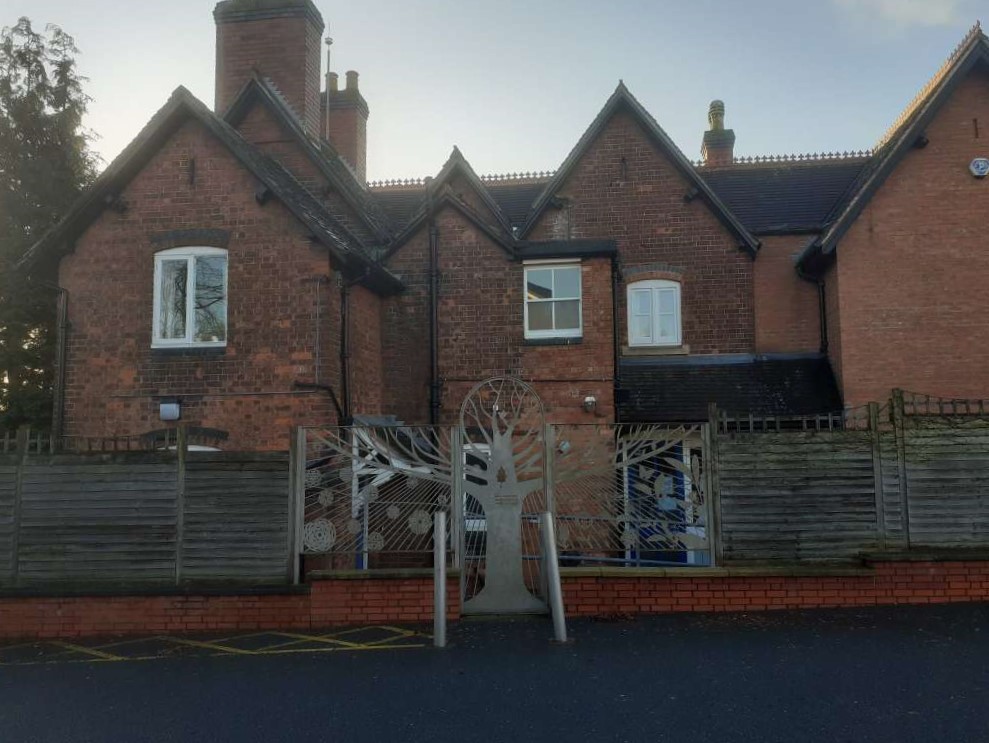
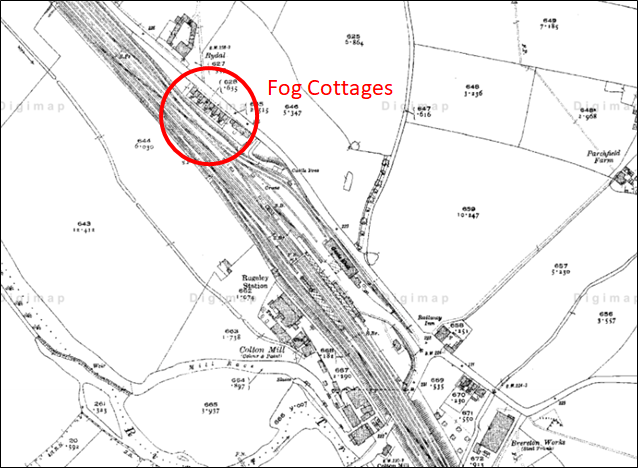
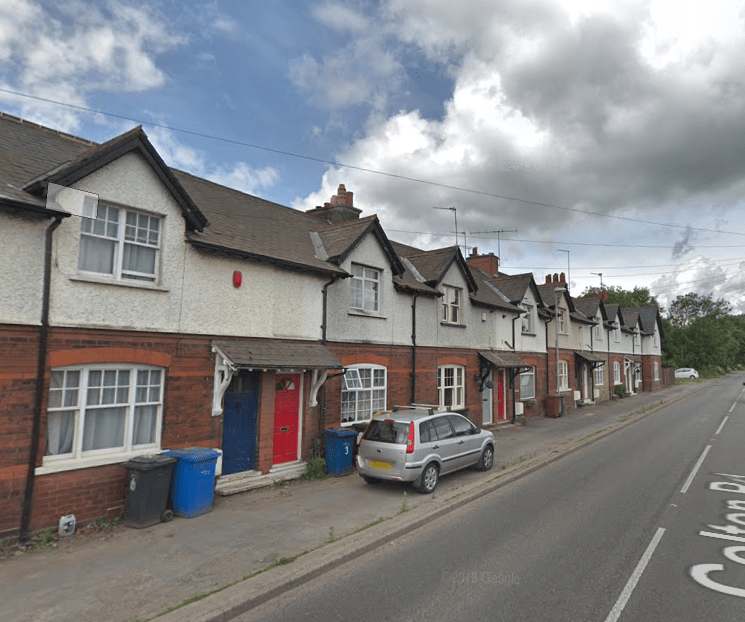
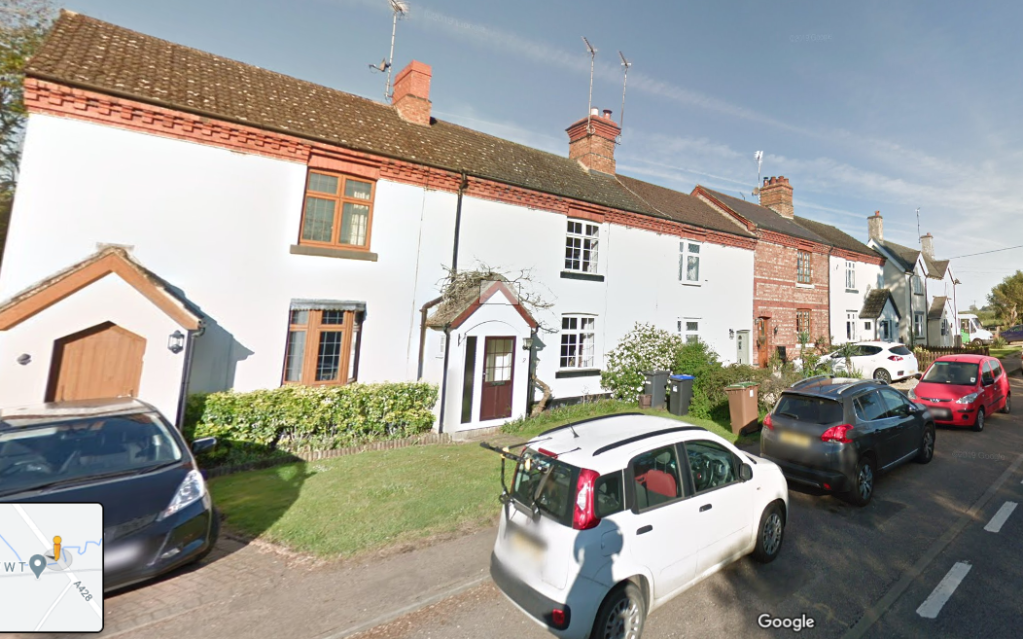
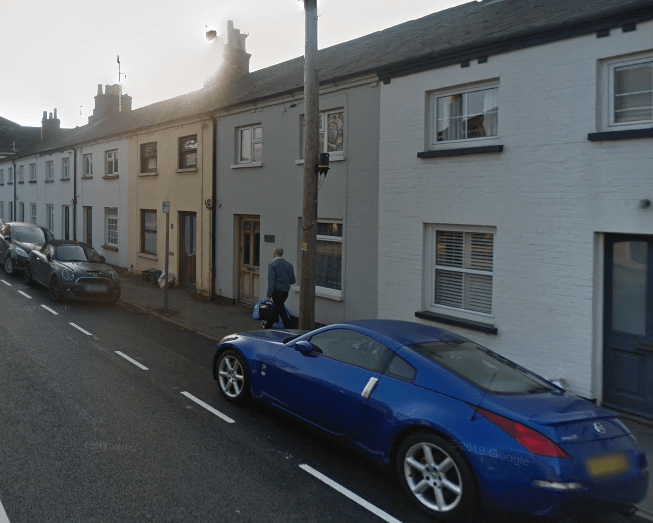
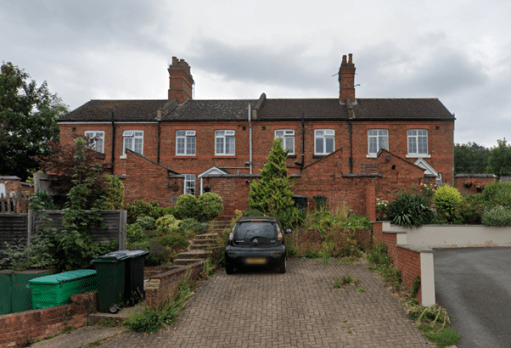
After his retirement William John and his family moved to Misterton Cottage. This is on the corner of Trent Valley Road and Wissage Road and still exists – as Holly Lodge – in the grounds of the Samuel Johnson Hospital – see the map and photograph below. It may indeed have been newly built at the time, perhaps under the direction of William John, as it does not appear on the 1848 tithe map but is present in the 1880 Ordnance Survey map. Its name is of course an echo of the Durrad’s roots in Northamptonshire. It was a substantial property. When it was eventually sold in 1890 it is described as being comprised of

Entrance Hall, Two reception rooms, Kitchen, Scullery, Pantry, Cellar, Four bedrooms, dressing room and WC. Well laid out gardens and a quarter of an acre of land.

Shortly after his resignation from the railway, William John took up the post as High Bailiff at Lichfield County Court, based in St. John’s Street, which he was to retain for the rest of his life. In this role he was responsible for executing warrants and court orders. He also had ecclesiastical responsibilities that may have dated back to his time as Station Master. Firstly, he was Apparitor to Archdeacon of Stafford, with the responsibility to summon witnesses and execute the orders of the ecclesiastical court. The Archdeacon, up to 1876, the Venerable Henry Moore. Secondly, he was sub-librarian in the Cathedral library, so he obviously retained his bibliographic interests. Both of these positions would have supplemented the pension from the LNWR.

In his civic roles he appeared regularly, if briefly each time, in the local press in the 1870s and 1880 – at the Mayor’s luncheon, the Sheriff’s breakfast and the perambulation of the city. He was also active in the St John’s Freemasons Lodge end held office there – as Junior Deacon in 1870 and as Junior Warden in 1876.  He also featured on an annual basis in the published list of partners in the Lloyds Banking Company Ltd., together with his son William Henry, who rose to become a Bank Manager in Rugeley in this period.  Presumably again, this was an additional source of income.

Walter Richard was married in 1874 to Sarah Stevens from Hertfordshire, and in the same year Arthur James, having graduated from Jesus College, was ordained Deacon in York. January 1882 saw the death of William Henry in Rugeley, from “congestion of the lungs”. A muffled peal of bells was rung at St Michael’s after evensong on a following Sunday, where both William Henry and his father had been regular ringers. Just two weeks after William Henry’s death, Bertram George, the youngest child, having also graduated from Jesus College, Cambridge, was ordained Deacon in Lichfield Cathedral. The following year William’s wife Elizabeth died from heart disease. Bertram married Margaret Wright from Marston Montgomery in Derbyshire in 1888. In 1881 Emma was a teacher and companion to the daughter of Frances Carver, a widowed farmer in Whaddon in Cambridgeshire.

Last days

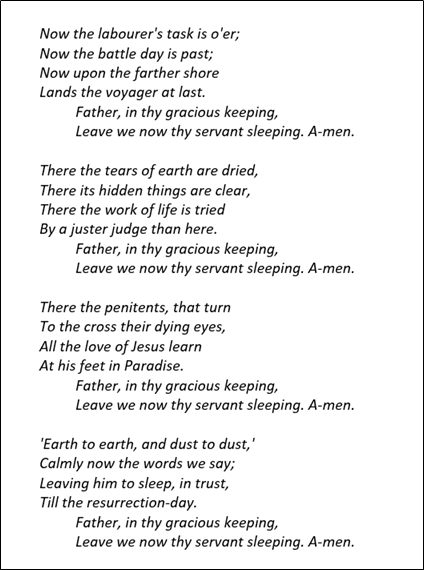
William John died in January 1889. His obituary records that he had been ill for several weeks beforehand following an operation from which he was never to recover. The lead mourners were of course his family – Arthur James, by then Vicar of Ellerburne near Pickering; Walter Richard, Foreign Correspondent’s Clerk at Coutts in London; Bertram George, the English Anglican Chaplain in Berlin; Emma Helen; and Mrs W. Durrad and Lizzie Durrad. The latter were the second wife and daughter of his cousin, the younger William from Eccleshall. His first wife Louisa had died in 1879, without having had children, and having moved to London, he married Elizabeth Whittle, 24 years his junior in 1881. Clearly William John had maintained contact with that branch of his family over the years. The funeral was a full choral service and at the burial the choir gathered around the grave and sang the hymn “Now the Labourer’s task is o’er”.

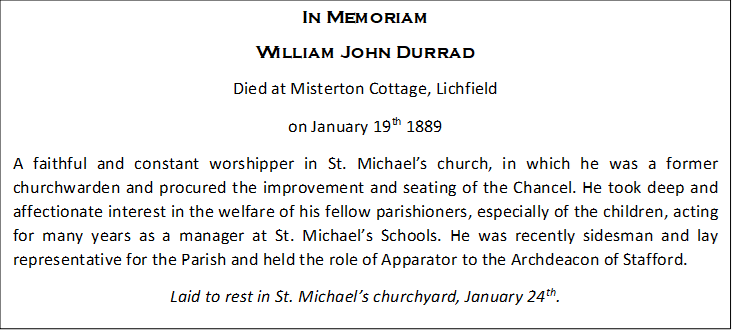
An obituary notice appeared in the February 1889 edition of the St Michael’s church Magazine, which sheds some further light on his work for the church.

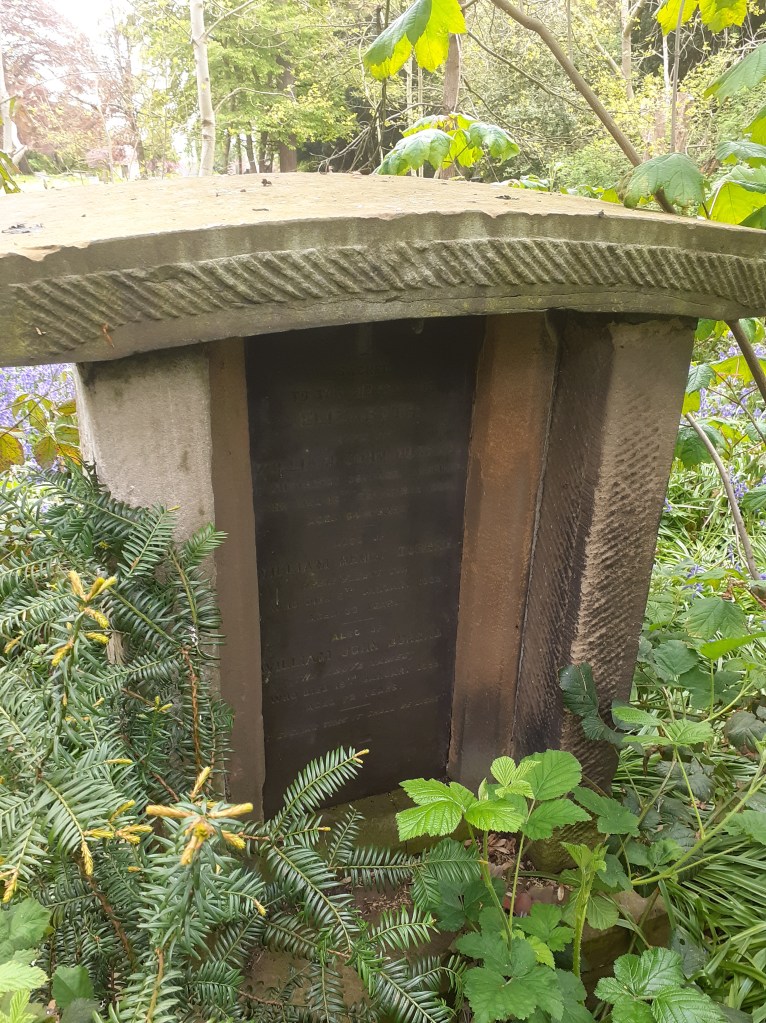
William John, his wife Elizabeth and his son William Henry are buried together in one grave in the graveyard of St Michael’s church. It is currently (May 2021) somewhat overgrown and difficult to access. Nonetheless its design is rather unusual as can be seen below.

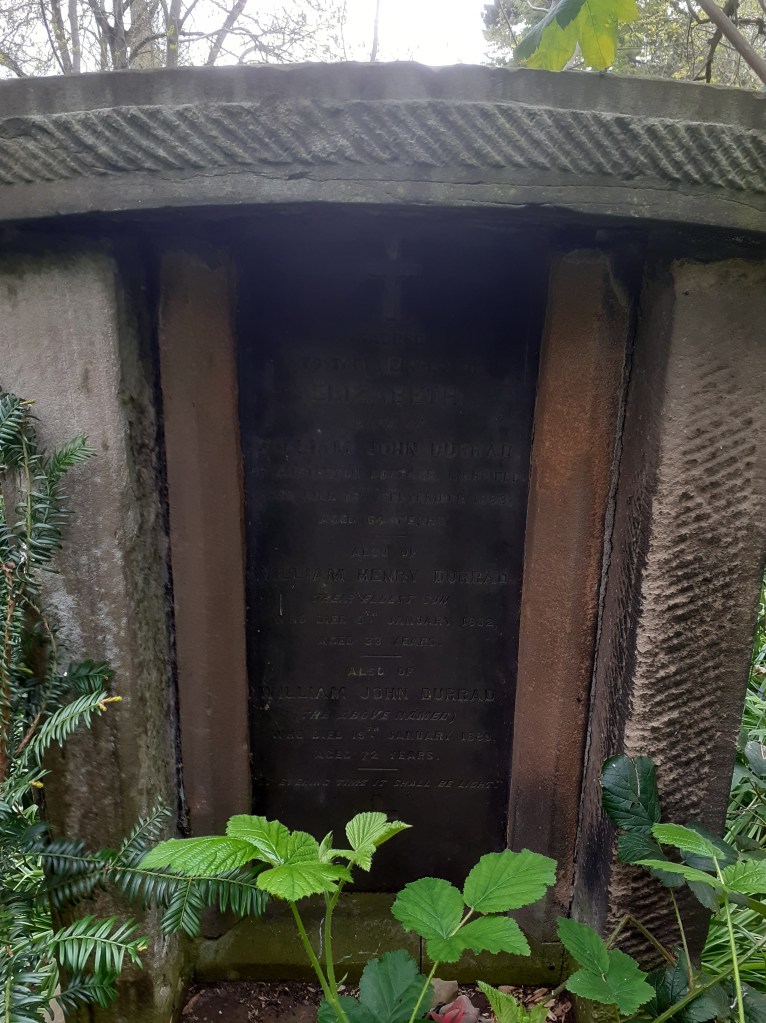
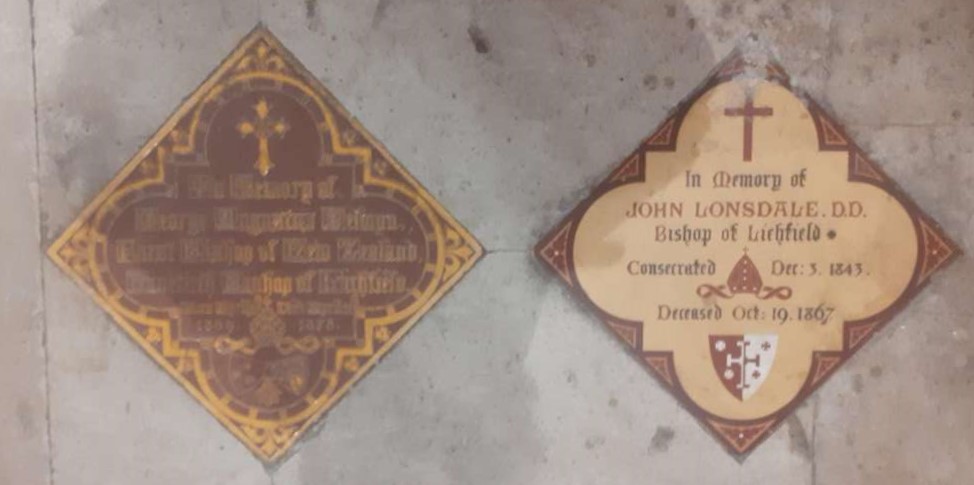
They are also commemorated in floor plaques in the church at the front of the chancel beneath the pulpit, These are positioned (deliberately?) on the opposite side of the chancel to two similar plaques commemorating the lives of two of the 19th century Bishops of Lichfield (Selwyn and Lonsdale) – see below. I strongly suspect this placement was deliberate on the part of the family and church leaders. This is perhaps a final indication of the perceived importance of the Station Master in Lichfield society at the time. 

The Durrad Memorial tablets in St. Michael’s Lichfield
The memorials to Bishop Londsdale and Bishop Selwyn
The placing of the Durrad memorials in St Michael’s. When the memorials were installed, the main font would have been just to left of the Bishop’s plaques. (For those who can spot such things, the combination of the Advent Candle ring on the left and a container of sanitizer on the pulpit steps on the right marks this photo as having been taken in December 2020.)

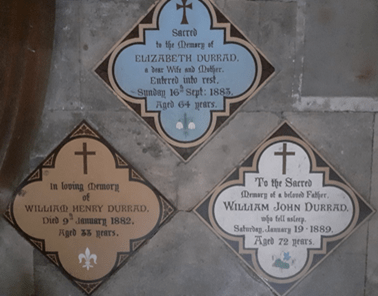
The Durrad memorials contain a further point of interest, in the symbols at the bottom of each plaque beneath the names. On that of William Henry, it is a fairly conventional and formal fleur -de-lis. On Elizabeth’s, we have the snowdrop – seen as a symbol of both death and rebirth. On William John’s plaque we have the Speedwell, or Veronica, a symbol of sympathy and mourning . Perhaps these decorations were deliberate and say something of the families feelings and the characters of those commemorated. Alternatively they may just have been what was available from the manufacturer’s catalogue!

In his will, with Arthur James and Bertram George named as executors, William John’s effects are said to be worth £3138, a very considerable sum. What this refers to is not clear, but probably includes Misterton Cottage and its contents, some land off the Walsall Road as well as his personal effects and any other savings . The year after the funeral Emma Helen married Frances Carver of Meldrith in Cambridgeshire (for whom she had worked as his daughter’s teacher and companion), Misterton Cottage was sold, and the Durrad family finally severed its connections with Lichfield.

A (half hearted) defence of Autonomous Vehicles and other transport innovations

Preamble

Over recent years it has almost become the norm amongst practicing railway engineers to pour scorn on any new transport proposal that emerges – for example Hyperloop, the autonomous metro system, being developed for Cambridgeshire, autonomous vehicles in general, vehicle platoons, bus rapid transit schemes and so on. Now whilst some new concepts deserve all the opprobrium that they receive and are often ideas looking for an application rather than the more sensible opposite, I want to argue in this post, that there is some merit in some of these concepts that deserves further consideration, particular as components of a rail based public transport network.

Before proceeding however, I need to be a little more explicit about those concepts that I do not believe are viable. These fall within two categories – very high- speed tube transport, and autonomous vehicles in mixed traffic situations. The former, exemplified by the monstrosity that is Hyperloop, faces very major technical difficulties. From my own aerodynamic perspective these include the difficulties of maintaining a controlled vacuum along very long tubes, and the highly complex unsteady forces that exists as flow speeds around some parts of the passenger capsule exceed the speed of sound i.e. locally supersonic flow with the Mach number >1.  With regard to the latter, I have seen no published information that these effects have been properly considered. Formidable as these technical issues are, they are of small concern in terms of the major practical issues of capacity (multiple tubes would be required to give the same capacity as high-speed trains); and safety (how these tubes would be evacuated in terms of an accident or fire). In these terms the concept is flawed.

Much of the hype concerning autonomous vehicles has been around the possibility of them providing door to door service with no human involvement in driving. I used to be of the view that this was a possible, if very long term, aim. I no longer think that that is the case, primarily for reasons of liability and safety. If there is an accident (as there will be) who is to blame – the passenger, the owner of the vehicle; the manufacturer; the software designer etc.? Who would wish to accept responsibility for injuries and fatalities? I believe that this consideration alone will cause the development of high levels of autonomy in private vehicles to stall – again when designers and engineers are faced with practical realities. I fear that autonomous vehicles are in the main “toys for the tech boys”. And they are boys – look at any AV website and count the relative number of males and females.

Having thus been dismissive of these two areas, let us proceed to think about those novel transport concepts that might have an application.

What are the viable concepts?

The two specific areas where I believe there might be possibilities of large-scale usage are in the field of tracked autonomy and platoons for public transport use.

Whilst I have doubts concerning the use autonomous vehicles on public highways, their use on restricted systems (let us call them tracks) seems to me less problematic. Such systems already exist in busways and bus metro concepts. Whilst many good railway folk would shout loudly that these would be better replaced by light railways or trams, these systems do have the distinct advantage in some areas of going where passengers wish to go rather than to some remote railway station – Cambridge is the classic example of this where the busway from St Ives allows buses to originate at a range of departure points in north Cambridgeshire, use the busway for the majority of the journey, and then end their journey in the city close to their place of work. Similar autonomous systems could equally be conceived, where the vehicle operate in a driverless mode whilst using the tracked system, with reduced staffing costs and redirection of staffing effort towards passenger care and revenue collection. If autonomous vehicles are restricted in this way, then the guidance system could be very much simpler than those currently proposed, with either short range infrastructure mounted wireless systems every few hundred yards or embedded in the tracked pavement.

The other novel area that has potential for significant use is the concept of platooning, particularly when combined with the idea of tracked autonomy. Autonomous tracked systems can in principle easily be configured to operate as platoons with the headway between vehicles along the platoon being controlled by the leading vehicle. Whist close platoon running will reduce aerodynamic drag and lead to reduced fuel use, the major advantage would be scalability, in that the capacity of such systems could be increased easily by adding extra vehicles in platoon, without a corresponding increase in staffing resource required.

Autonomous Platoon Transport (APT)

These thoughts lead me to propose a new hybrid concept, which I will refer to as Autonomous Platoon Transport  (APT), largely because I rather like the acronym and its associations. APT would have the following components.

  • Self-powered vehicles (almost certainly electric, but I would be open to hydrogen power if only to further irritate some of my rail readers) that have the ability to operate as ordinary vehicles on public roads, or as autonomous vehicles on reserved track. I would envisage a typical vehicle capacity to be around 30 to 40.
  • A simple paved road, single carriageway track (with passing places) with suitable guidance sensors either at trackside or embedded within the pavement – this would be much cheaper and easier to construct than a light railway or tramway.
  • These would operate as driven vehicles away from the reserved track, and as autonomous vehicles, either individually or in platoons, on the reserved track.
  • In principle vehicles could be either passenger or freight, although the latter might make significant demands upon pavement design. The operation of freight APTs would be of a different nature to those for passengers, and I won’t consider then further in this post.

I make no claims that such a concept would replace existing public transport systems, but I will argue in what follows that there are some circumstances where it could complement such systems.

Possible passenger applications

Conventional rail and tram systems have obvious advantages for long distance travel and for travel within major conurbations and meet the journey time and capacity requirements well. The specific areas where APT systems might have a role is where there is large variation of demand either geographically (with many small trip origins) or temporally (with large seasonal variations), or where there are major capital cost constraints that mitigate against the use of conventional rail.

First consider geographical constraints. The type situation here is that of Cambridge and its regions – and indeed the APT system bears a strong resemblance to the proposed Cambridge Autonomous Metro system, although with the use of driver-controlled vehicles at its outer limbs and autonomous platoon running in the central region. Here there is a large, dispersed commuter demand around the city that cannot be met economically by conventional systems but could potentially be met by the cheaper infrastructure required for APT operation. Cambridge is a special case in that the historic nature of the centre requires the hub of the system to be underground, but there are many other towns and cities of a similar size and with similar characteristics, where the central routes, where platoon operation would be in place, would be at surface level.

Typical temporally constrained routes would be rail routes with generally low local usage, but high usage in the summer months – such as coastal branch lines, where overcrowding, often to very unpleasant levels, can occur. The advantage of an APT system would be that it would be easily scalable in terms of capacity without the need for an increase in staffing resource. Whilst the base service might be operated by one APT vehicle, with a driver or passenger manager, this would be supplemented in peak times by other vehicles in platoon – perhaps diverted from those towns and cities with geographical constraints but where demand falls during the summer months and a reduced service is all that is required. This has implications concerning the nature of the infrastructure – either such lines need to be converted to operate in this mode, with paved instead of rail formations, or a new track needs to be constructed along the route, or a hybrid paved / track formation needs to be developed. I suspect the latter would prove to be a challenge, but could allow rail usage when appropriate, although new types of control and safety system would be required. This will bring accusations that I am a closet supporter of converting railways to roads. But no, I am not funded by the TPA (or anyone else come to that) – I am simply interested in providing the most appropriate services for customers that gets them to their destination in reasonable comfort and security. (Interestingly note the reversal in order of acronyms from APT to TPA – a device commonly used in Satanic circles I understand).

The third use of such a system might be in the re-use of old railway lines where rail re-instatement is simply not possible because of major track obstructions / loss of infrastructure. As an example, we might consider the Penrith – Keswick – Workington route in Cumbria. Here an APT system could be used along the existing trackway where this is still in place, with on road / driver sections where major infrastructure no longer exists – primarily in this case at the start and end of the route. Local demand would be small, but the much larger seasonal demand could be met by again scaling the number of vehicles and using platoon running for most of the route.

Finally, the concept could be applied to longer routes where there are both geographical and temporal constraints. A typical case here might be the Cambrian Coat line, where demand is highly seasonal. There are also geographical constraints in the dispersed nature of the communities it serves, and the lack of connectivity to surrounding areas. Thus for example one could envisage the base demand could be met by APT vehicles in short platoons, but joining and leaving the platoons at different places to more directly serve surrounding areas – for example at Harlech to serve the town and connect to Blaenau Ffestiniog, or at Porthmadoc, to again serve the town and to connect to Caernarfon. Such a scheme would rely on a hybrid track form, in order that through trains could operate to Birmingham and that the large summer demand could be met. Again there would be design and operational challenges.

Final thoughts

I suspect many will disagree with some or all of what I have written in this post – hopefully in a civil fashion. And of course all I have written is provisional and might not survive translation into a practical reality. All I would hope is that it encourages discussion of the use of novel transport systems, and how they might complement a modern transport network, rather than simply dismissing them.

The NIC report on “Rail needs assessment for the Midlands and the North” – common sense or betrayal?

Preamble

The National Infrastructure Commission report of December 2020 “Rail needs assessment for the Midlands and the North” has caused something of a stir in the rail industry. The NIC was tasked to look at how the proposals for HS2 and the Northern Powerhouse Rail could best be integrated. It considered two ranges of options  – one that prioritised regional links in the North and Midlands, and one that prioritised long distance links. All options integrated phase 1 and phase 2a of HS2 from London to Birmingham and Manchester, but only the long-distance option included the eastern arm of the original Y shaped network to the East Midlands and Leeds. On the basis of a wide range of indicators, including cost and deliverability, the report concluded that the prioritisation of regional links was to be preferred – cue loud denunciations, accusation of scrapping HS2 abandoning the Midlands and North and so on.   

My first reaction was astonishment that the proposals should have come as a surprise to rail industry commentators – it has been evident to me at least for a few months that some post Covid financial realism was necessary to rein in all the potential major railway projects on the table. Also the eminently sensible and rational Greengauge 21 has recently made very similar proposals, urging that the eastern arm of HS2 be built in a number of phases and repurposed to provide links between regional centres. However, my initial reaction was to share the view of those in the industry, that the conclusions were to be regretted, although perhaps with a greater sense of fatalism than most that this was going to happen anyway.

But then I read the report. I found it to be well laid out, with a convincing set of underlying assumptions and methodology. I have to say I have a great deal of sympathy with its conclusions, which should lose me a few followers on Twitter if nothing else. The basic points that came across to me were that the construction of all the rail schemes currently under discussion is unaffordable, and that the number of passengers travelling between regional centres is significantly greater than those travelling between these centres and London . Post-covid this discrepancy is likely to grow. In this brief post, I want to set out what I see as the benefits of the prioritisation of regional links over long-distance links.

The proposals

The proposals are summarised in figure 1 below from the NIC report. The report firstly sets out a baseline set of improvements that are already underway or committed to – the western leg of HS2, main line speed upgrades (ECML, MML, Manchester-Sheffield); Transpennine upgrade and Midlands Railhub upgrades. Two sets of proposals are provided for each prioritisation – one at the baseline cost plus 25% and one at the baseline cost + 50%. In the main I will consider the baseline + 50% options. The long-distance prioritisation is based on the Y shaped HS2 network, together with a partly new line between Leeds and Manchester, with upgrades to the ECML to serve the north east and Scotland and further upgrades of track in the Midlands and Lancashire. The regional prioritisation assume the western leg of HS2 to Birmingham and Manchester will be completed, but with the eastern leg replaced by high-speed lines from Birmingham to the East Midlands and from Leeds to Liverpool, with major upgrades to the lines from the new East Midlands line to Nottingham, Derby, Sheffield and Leeds; from Sheffield to Manchester; and from Leeds to the North East. Oddly for the regional prioritisation, the baseline + 25% case also sees a major ECML upgrade from Leeds to London, whereas this does not figure in the baseline + 50% option.

Figure 1

The overall benefits from the proposals are set out in table 1 below for the +50% options – taken directly from the NIC report. It can be seen that prioritising regional links delivers the greatest benefit. Journey time and service level details are given in table 2.

Table 1 – Analysis of baseline +50% scenarios
Table 2 – Journey times for baseline + 50% scenarios

The benefits of regional prioritisation

I will admit that my reasons for liking the regional proposals are very parochial and reflect the fact that I live in the Midlands between Birmingham, Derby and Nottingham. I suspect my views might be different should I live in Leeds. That being said, the major benefits from my perspective are as follows.

  • Links between Birmingham and the East Midlands (and Nottingham in particular) are much better than those offered by the current HS2 proposals, which would need to be routed through the proposed East Midlands Hub at Toton (27 minutes as opposed to 53 minutes).
  • Nottingham gains a direct link to the high-speed line facilitating faster overall journey times to London. (58 as opposed to 89 minutes).
  • The need for the East Midlands Hub at Toton is removed. The proposal for a hub there has always been in my view a mistake of potential historical significance. Such a station would suck the life out of the centres of Nottingham and Derby into a new urban centre at Toton which, because of its proximity to the M1 and A52, would also very likely be a major generator of road traffic in the area.
  • Services within and across the East Midlands, Yorkshire and Lancashire would be greatly enhanced – see table 2.

In addition, a link from the line from Derby to Birmingham to HS2 at Tamworth, would allow high-speed running most of the way from London to Derby. It is also of interest to note that the route of the proposed high-speed line to Nottingham appears to be further south than the current HS2 proposal and would allow a new station to be built close to East Midlands Airport. This would thus allow for a high-speed connection with Birmingham Airport, which would allow greater operational flexibility. for both airports.

The drawbacks of regional prioritisation

The main selling points of the current HS2 scheme are decreased journey times and the release of capacity on the classic network for other services, both passenger and freight. With regard to the former, table 2 shows that for the regional-links option journey times are mostly decreased from the long-distance links option between centres other than London. London to Sheffield, Leeds and Newcastle take 6. 12 and 37 minutes longer for the former than for the latter. The first two I would suggest are hardly significant. If the ECML upgrade is included in the regional-links option, the Newcastle / London time takes just 3 minutes longer than the long-distance option – as noted above this was, oddly, included in the +25% regional links option but not the +50% option.

The issue of capacity has also been addressed by the report. Whilst there can be seen to be significant benefits to the number of inter-regional services that it is possible to schedule, the report admits that the regional-links approach does little to release freight paths on the ECML and in the North and Midlands. This will not please the rail freight sector of course and must be seen as a weakness of the regional-links proposal.

One other point. The report only briefly mentions Scottish links. Those that are proposed in the HS2 plans for the WCML and the western arm of HS2 will not of course be affected. Those that are proposed for the eastern arm and the ECML will be affected to the same level as the Newcastle services – and the effects can be minimised by an ECML upgrade. This being said, I strongly suspect by the time these upgrades are delivered, we will have an independent Scotland and a united Ireland, with a transport focus on an east west corridor with high speed ferries from the continent to Edinburgh connecting with cross Scotland lines to high speed ferries to Ireland. Links to London and England in general will be of less concern, and may well involve customs and passport checks.

Final thoughts

As noted above, I find the report and its conclusions plausible and convincing. It is not ideal of course, particularly with regard to freight capacity, but it does seem to me to be realistic, and at least from my Midlands perspective, offers significant benefits. I strongly suspect however that that won’t be everyone’s view.

The St. Michael chalice of 1684

In A History of the County of Stafford: Volume 14, Lichfield we read the following in the section devoted to St. Michael’s church in Lichfield.

At some date a silver-gilt chalice and paten of 1684 were acquired. They were sold with a pewter flagon and plates in 1852 to a Birmingham firm in part payment for a new set of plate. The chalice and paten of 1684 were bought the same year by St. Clement’s, Oxford.

Clearly this was later regretted and we read

… attempts in 1892 and 1923 to recover them for St. Michael’s were unsuccessful.

And there I might have left the matter, perhaps as a sort of parable on the foolishness of church wardens, and the futility of the pursuit of modernity, but for the all seeing eye of Google. A quick search of “chalice / St Clements / Oxford” let me to An Inventory of the Historical Monuments in the City of Oxford from 1929 in which I found the rather poor photograph of the 1684 chalice shown below. It is rather fuzzy, but I think the motif is clear enough – the winged archangel trampling over the devil at his feet. I can’t read the caption, so if any reader can enlighten me on this I would be grateful. The question arises as to where the chalice and its associated paten are now. To find the answer to this would I am afraid take more than a quick Google search. Perhaps one day….

Engineers, roads and ethical standards

See the source image
Silvertown Tunnel Scheme

It is now established beyond all doubt that the unrestrained growth in road vehicle traffic is bringing many undesirable effects. Annually  around 1750 pedestrians are killed by cars in the UK, and 25000 seriously injured. The poor air quality that results from gaseous and particulate emissions from roads and vehicles results in significant adverse effects on the health of those who live in urban areas, children in particular. High levels of traffic can be both unattractive and dangerous for other road users such as pedestrians and cyclists and can discourage these active modes of transport. Again, this can lead to adverse health effects, seen particularly in the increase in childhood obesity.  Large areas of land are given over to sterile car parks that could be more profitably used for other activities. The effects on communities and urban environments is also significant and there is clear evidence that restricting car use can increase the vitality and livability of such areas and lead to real social and health benefits for the poorest in society. To these should be added the fact that the road sector is the major cause of greenhouse gas emissions in the developed world, and that road vehicles use precious energy resources in an unsustainable way. All these effects are well known and proven to high levels of reliability, and fully appreciated by most Transportation Engineers and Planners.

And yet…… Major road improvements are still carried out and new roads built, which inevitably results in further induced growth in traffic, magnifying the issues set out above. Induced traffic growth is of course often conveniently ignored in scheme appraisal. New housing developments are built, with major areas given up to parking and no provision for public or active transport. Low Traffic Neighbourhoods are now a political issue within the culture wars narrative and are more often removed than implemented.

My community, that of professional engineers, see these things and in the main recognize the folly of them. We regret them but we shrug our shoulders and carry on. In the end, we say, we have to provide what clients want, and we design and build road scheme after road scheme, housing estate after housing estate, knowing all the time that these will only result in more health problems, more congestion, more accidents and deaths and a degraded environment. The time has come when I would suggest we, as engineers, need to look very seriously at ourselves and our actions.

I am a Fellow of a number of professional institutions. Of these the two most relevant to the issues addressed here are the Institution of Civil Engineers, and the Chartered Institution of Highways and Transportation. The ICE Rules of Professional Conduct include the following clauses

3. All members shall have full regard for the public interest, particularly in relation to matters of health and safety, and in relation to the well-being of future generations.

4. All members shall show due regard for the environment and for the sustainable management of natural resources.

The CIHT Code of conduct contains something similar.

Members of the Institution must give due weight to all relevant law, facts and best practice guidance, and the wider public interest. They must:

  • minimise and justify any adverse effect on society or on the natural environment for their own and succeeding generations;
  • take due account of the limited availability of natural and human resources;
  • hold paramount the health, welfare and safety of others;

It seems to me that there is at least an arguable case that by knowingly being involved in road building developments which will lead to adverse effects for existing and future generations, and will consume limited natural resources in an uncontrolled way, professional engineers are in breach of their own institutional codes of conduct that bind them. Further this action could, in principle, lead to formal complaints made about the involvement of individuals. Indeed  the CIHT code of conduct lays a duty of complaint on its Members and Fellows to “report any violation of this Code by a member to CIHT”.

Without the involvement of engineers very many fewer environmentally, medically and socially damaging schemes would get off the ground and none would be designed and built. I would suggest that we are approaching a point where individuals and firms, and indeed the entire profession will need to make a choice – to comply with our own ethical codes and take them seriously or to ignore them. It is not a question that will be able to be avoided much longer.

Cricket and Football in Pensnett in the 19th Century

Introduction

The 19th century was of course the great era for the development of mass participation sports in England. At the start of the century the laws of cricket, the major summer sport, had been codified by the M.C.C. and the game developed over our period from one based on clubs and informal societies, playing “friendly” if competitive games, to one based on counties, with the highly competitive County Championship being finally established in 1890. Locally in 1889 the Birmingham and District Cricket League, the oldest in the world, was formed, consisting of seven teams from Birmingham and the Black Country.  The major winter sports were of course all variations of football, and the century saw the codification of the rules of association football, rugby union and rugby league. Again most of the games were “friendlies” but competition came through a number of cup competitions – the FA cup from 1871 and locally the Birmingham Senior cup from 1876, and later through leagues – the Football league itself from 1888 and the local Birmingham and District league from a year later.

Cricket in Pensnett

The information on what sports were played in Pensnett in the latter half of the nineteenth century is limited, but a little can be gleaned from local newspapers. It seems that there was a cricket team from the 1850s onwards, and several football teams from the 1880s. A cricket match between Pensnett Victoria and Kingswinford is recorded from 1859, with a win for the former.  The scorecard is given below. Note that this is a one-day game yet featured two innings from each side – the pitches were of course not prepared, and the batsman’s task was more than a little difficult.

Pensnett Victoria versus Kingswinford scorecard 1859

Over the course of the following decades, further matches are recorded against a range of local sides- for example Wednesbury, Brierley Hill Amateurs, West Bromwich Peep O’Day, Netherton, Droitwich, Bridgnorth and Oldbury.  The press mentions of the club cease after a notice of a General Meeting was published in March 1875 – either because the club ceased to function or because it simply stopped sending match reports to the newspapers. Reports resume about 15 years later with a small number of matches reported between1889 and 1894. Victoria was not the only Pensnett team however. A Pensnett Albion team was reported in 1864, and for a brief period in the early 1880s there also seems to have been a Pensnett Vicarage cricket team, which played three matches in 1881 winning the first but losing the last two by large margins. Also, in 1887 a match between Pensnett Oak Farm and Smethwick Eagle Works is recorded. Most of these were again two innings matches, with scores being typically low at around 30 or 40 per innings.

An interesting variant was the “single wicket match” and a report on such a match (between Pensnett Victoria and Brierly Hill Amateur) is given below. It is not clear what the rules were for this game, but clearly it involved two players a side which batted sequentially. Cricket, Jim, but not as we know it.

Report of single wicket match between Pensnett Victoria and Brierley Hill Amateur in 1867

Pensnett Football Teams

A Pensnett football team existed from the early 1880s and fielded both first and second teams, playing at a ground near Lenches Bridge. The first recorded match was in 1881 against Brierley Hill. Numerous further matches are recorded between 1882 and 1885 including some with the major teams in the area – for example with Stourbridge Standard first and second teams (the forerunner of the current Stoubridge club), Dudley, and West Bromwich Albion second team, as well as against more local teams such as Brockmoor Harriers and Lower Gornal Excelsior. As far as it is possible to tell most of these matches in the early days were ”friendlies”. The only competitive match that was recorded was in 1883, where Pensnett beat St John’s Swifts of Birmingham 6-1 in a “cup tie”, but the nature of the competition is not clear.

After 1885 the situation becomes somewhat confused with a paucity of press reports, and the ones that do appear refer to different teams – Pensnett Rovers, Pensnett Junior, Pensnett Villa and Commonside Unity. A Pensnett Victoria team appears in 1889, at the same time as the reappearance of the cricket club. A court case of 1892 over payment for a field at Lenches Bridge on which to play both football and cricket, refers to the Pensnett Victoria Football and Cricket Club – possibly a refoundation of the former club (BNA 1892). Again, most of the football matches that were played in the later period were friendlies, but more competitive games also took place. In 1889 the local newspapers give quite full details of the Pensnett Charity cup – a knockout competition for around twenty local teams, including Pensnett Juniors, Brockmoor Harriers, Kingswinford White Star and Kingswinford Rovers.

The situation changed however in1899 with the formation of the Brierley Hill and District Football League, in which Pensnett Victoria played. A late season league table is shown below. This really marked the end of the era of friendlies, and from this point on the structure of the game became league based, and much more familiar to modern eyes.

Brierley Hill League Table 31st March 1900

It was mentioned above that the Pensnett football ground was at Lenches bridge in both the early 1880s and early 1890s,  possibly on the Kingswinford side of the bridge, just outside the parish where the land was available and flat enough to accommodate a suitable pitch – see the extract from the 1882 OS map below with possible sites marked. Clearly in the early 1890s, the cricket ground was there as well, and that may well also have been its location in the 1860s and 1870s.

1882 Ordnance Survey map – possible football (and cricket?) ground locations shown as brown circles

The players

From the match reports in the newspapers, it is possible to identify the names of some of those who played for the cricket and football teams. In principle it is then possible, through the use of census information, to find out a little more about these individuals. I say “in principle” because it is not always easy. Often only surnames or initials are published and these can’t be unambiguously identified with specific individuals. That being said, it has been possible to identify with some certainty seventeen individuals who played for the cricket team between 1859 and 1872, and seven of those who played for the football team between 1882 and 1883. In terms of their profession, both sets of players reflect the make up of the area at the time, with a mix of skilled and unskilled industrial workers, and a few from other trades. For example, the seventeen cricket players included labourers, miners, boiler and chain makers, engineers and shopkeepers and the same mix can be seen in the football players.  The three cricketers from the 1859 scorecard who can be identified are the opener batsman, Joseph Bache (27) who was a chemist and druggist on High St, John Caswell (18) who was an engine fitter from Chapel St., and William Caswell (19) who was a chain maker from Tansey Green. The two Pensnett players who took part in the double wicket match in 1867 described above were William Yates (23) an Ironworks labourer from John St in Brierley Hill, and Thomas Baker (37) a coal miner from Chapel St. The other point that emerges from these considerations is that by no means all the players came from the parish of Pensnett itself. Of the seventeen cricketers identified, seven came from neighbouring parishes (Kingswinford, Brierley Hill and Brockmoor) and of the football players, only one came from Pensnett (the captain, Albert Colley (25), a timber merchant from Bradley Street) with the rest again coming from neighbouring parishes.

Footnote

Finally, two other points are worthy of note before we end. Firstly, whilst the football played by the various teams in Pensnett was at what might be called junior level, the senior level of the game was played just outside the parish. Brierley Hill Alliance was formed in 1887 from a merger of Brockmoor Harriers and Brockmoor Pickwick and, before they moved to their Cottage Street Ground in Brierley Hill in 1888, played on the Labour in Vain ground in Brockmoor, a few hundred yards out of Pensnett parish. They went on to join the Birmingham League in 1890 and remained there, with some success, up to their eventual demise in 1981. Secondly, the name of Pensnett Victoria is not confined to the football and cricket teams. In 1880 a few matches played by a Pensnett Victoria Quoits team are reported. However, most newspaper mentions of the name refer to performances of the Pensnett Victoria Saxhorn band. If the reader, like me, doesn’t know what a Saxhorn is, then Wikipedia has the answer.

Some thoughts on ventilation and pathogen concentration build up

Modeling airflow scenarios in classrooms
Covid spread from CFD studies

Introduction

Up till recently most attention had been focused on the spread of Covid-19 by near field transmission – being in close proximity to an infected person for a certain amount of time, and rather ad hoc social distancing rules have been imposed to attempt to reduce transmission. However, there is another aspect of transmission – the gradual build up of pathogen concentrations in the far field in enclosed spaces due to inadequate ventilation. The importance of this mode of transmission is beginning to be recognised – see for example a recent seminar hosted by the University of Birmingham. The main tool that seems to have been used for both near and far field dispersion is Computational Fluid Dynamics (CFD) – see the graphic above from the University of Minnesota for example. Now whilst such methods are powerful and can produce detailed information, they are very much situation specific and not always easy to generalise. This post therefore develops a simple (one could even say simplistic) method for looking at the far field build up of pathogens in an enclosed space, in a very general way, to try to obtain a basic understanding of the issues involved and arrive at very general conclusions.

The model

We begin with equation (1) below. This is a simple differential equation that relates the rate of change of concentration of pathogen in an enclosed volume to the pathogen emitted from one or more individuals via respiration and the pathogen removed by a ventilation system. This assumes that the pathogen is well mixed in the volume and is a simple statement of conservation of volume.

From the point of view of an individual, the important parameter is the pathogen dose. This is given by equation (2) and is the volume of pathogen ingested over time through respiration. The respiration rate here is assumed to be the same as that of the infected individual.

Equations (1) and (2) can be expressed in the normalised form of equations (3) and (4) and simply solved to give equations (5) and (6).

Equations (5) and (6) are plotted in figures 1 and 2. Note that an increment of 1.0 in the normalised time in this figure corresponds to one complete air change in the enclosed volume. It can be seen that after around three complete air changes the concentration of pathogen reaches an equilibrium value and the dose increases linearly, whatever the starting concentration. To the level of approximation that we are considering here we can write the relationship between normalised dose and time in the form of equation (7), which results in the non-normalised form of equation (8).

Assuming that there is a critical dose, the critical time after which this occurs is then given by equation (9).

Equation (9), although almost trivial, is of some interest. It indicates that the time required for an individual to receive acritical dose of pathogen is proportional to the volume of the enclosure and the ventilation rate. This is very reasonable – the bigger the enclosure and the higher the ventilation, the longer the time required. The critical time is inversely proportional to the concentration of the emission, which is again reasonable, but inversely proportional to the square of the respiration rate. This is quite significant and a twofold increase in respiration rate (say when taking exercise or dancing) results in the time for a critical dose being reduced by a factor of 4, or alternatively the need for ventilation rate to increase by a factor of 4 to keep the critical time constant. Similarly if there are two rather than one infected individuals in the space, then the respiration rate will double, with a reduction in the critical time by a factor of four.

Discussion

Now consider the implications of this equation for two specific circumstances that are of concern to me – travelling on public transport (and particularly trains) and attending church services. With regard to the former, perhaps the first thing to observe is that there is little evidence of Covid-19 transmission on trains, and calculated risks are low. In terms of the far field exposure considered here, respiration rates are likely to be low as passengers will in general be relaxed and sitting. This will increase the time to for a critical dose. On modern trains there will be an adequate ventilation system, and the time to reach a critical dose will be proportional to its performance. Nonetheless the likelihood of reaching the critical level increases with journey time – thus there is a prima facie need for better ventilation systems on trains that undergo longer journeys than those that are used for short journeys only. For trains without ventilation systems (such as for example the elderly Class 323 stock I use regularly on the Cross City line) has window ventilation only, and in the winter these are often shut. Thus ventilation rates will be low and the time to achieve a critical dose will be small.

See the source image
Class 323 at Birmingham New Street

Now consider the case of churches. Many church buildings are large and thus from equation (9) the critical times will be high. However most church buildings do not possess a ventilation system of any kind, and ventilation is via general leakage. Whilst for many churches this leakage this can be considerable (….the church was draughty to day vicar….), some are reasonable well sealed – this will thus, from equation (9) tend to reduce the critical time. In this case too the respiration rate is important. As noted above the critical time is proportional to the respiration rate squared. As the rate increases significantly when singing, this gives a justification for the singing bans that have been imposed.

File:Thornbury.church.interior.arp.750pix.jpg - Wikimedia Commons
Church interior – Wikipedia Commons

The above analysis is a broad brush approach indeed, and in some ways merely states the obvious. However it does give something of a handle on how pathogen dose is dependent on a number of factors, that may help in the making of relevant decisions. To become really useful a critical dose and initial pathogen concentration need to be specified together with site specific values of enclosed volume, ventilation rate and expected respiration rates. This would give at least approximate values of the time taken to reach a critical dose in any specific circumstance.

Tornadoes and debris

Get the facts about tornadoes - Chronicle Media

The debris trajectory animations of Figures 6 to 11 were provided by Professor Mark Sterling, whose ability to use advanced EXCEL functions seems to be significantly greater than mine. His contribution is much appreciated.

Previous work

In 2017 Mark Sterling and I published the paper “Modelling wind field and debris flight in tornadoes”, which described the integration of a tornado wind field model and the debris flight equations to look at the pattern of compact debris movement in tornadoes of different types. Typical results for falling and flying debris are shown in figure 1 below and give an indication of the complexity of the debris trajectories that were predicted.

Figure 1. Debris Trajectories from 2017 model

Now whilst the tornado wind model that was used in the analysis was a considerable improvement over those that existed at the time, in that it gave a consistent three dimensional velocity formulation, it did however have one major drawback. This was the fact that the vertical velocity component was unbound and increased with height, albeit quite slowly. In a more recent paper in 2020 “The lodging of crops by tornadoes”, we developed an improved model, in which the vertical velocity peaked at a certain height and then decreased at greater heights. In this blog post I will briefly explore  the use of this wind model to predict compact debris flight paths using the same methodology as in the first paper, and in doing so will illustrate the importance of the tornado model on debris trajectory prediction.

The tornado wind model

Figure 2. Velocities from 2020 model

The expressions for the radial, circumferential and vertical velocities in the 2020 model are given in figure 2. Here the velocities are normalized by the maximum circumferential velocity and the radial and vertical distances by the radius at which the maximum velocity occurs. Note that this is different from the 2017 paper where the maximum radial velocity was used for normalization. The parameter K is related to what will be termed the swirl ratio S (the ratio of the maximum circumferential to maximum radial velocity) by a function of the parameter gamma, which is a shape parameter that affects the shape of the radial and vertical profiles. (Unfortunately this web template doesn’t support Greek letters, so I have to spell them out). Figure 3 shows typical velocity profiles for different values of this parameter.  It can be seen that for gamma = 2, the peak of the vertical velocity is at the vortex centre, as in a typical single cell vortex, whilst for higher values it moves away from the centre becoming more like a two cell vortex (but note there is no downflow at the vortex centre in this case.

Debris flight equations

The equations for compact debris flight are given in figure 4. These are the same as in the 2017 paper, although expressed a little differently. The debris velocities (lowercase) in the three directions are again normalized by the maximum tangential tornado velocity. Two dimensionless parameter are identified – the Tachikawa number Ta that relates the flow force on the debris particle to its weight, and a tornado Froude number Fr. Different dimensionless parameters were used in the 2017 paper, because of the different reference velocity that was used

Figure 4. Debris flight equations

Solutions

Figure 5. Base case parameters

Putting together the velocity equations in figure 2 and the particle flight equations in figure 4, it can be seen that there are four parameter that define debris trajectories – the tornado parameters S, gamma and Fr, and the debris Tachikawa number Ta. In addition any one flight trajectory will be defined, at least in its early stages by the dimensionless values of the radius and height at its release point. If these six parameters are specified then the equations of debris flight can be solved in a straightforward manner.  In what follows we define a base case situation as in figure 5, and then vary each of the parameters around this base case value. We present the results in the animations of figures 6 to 11.Each animation shows four plots – the trajectories projected onto a vertical plane through the tornado centre; the trajectories projected onto a horizontal plane; the trajectories in a rotating plane in the radial and vertical directions, and a plot of the variation of particle kinetic energy with time. The latter acts as a damage indicator of debris flight, but also clearly shows whether or not the solution converges or diverges with time. Note that the dimensionless time shown in the kinetic energy plots is proportional to the time of revolution of the vortex – a time of 2 pi corresponds to one vortex revolution. 

aaaaaaaaaaaaaaaaaaaaaaaaaaaaaaaaaaaaaaaaaaaaaaaaaaaaaaaaaaaaaaaaaaaaaaaaaaaaaaaaaaaaaaaaaaaaaaaaaaaaaaaaaaaaaaaaaaaaaaaaaaaaaaaaaaaaaaaaaaaaaaaaaaaaaaaaaaaaaaaaaaaaaaaaaaaaaaaaaaaaaaaaaaaaaaaaaaaaaaaaaaaaaaaaaaaaaaaaaaaaaaaaaaaaaaaaaaaaaaaaaaaaaaaaaaaaaaaaaaaaaaaaaaaaaaaaaaaaaaaaaaaaaaaaaaaaaaaaaaaaaaaaaaaaaaaaaaaaaaaaaaaaaaaaaaaaaaaaaaaaaaaaaaaaaaaaaaaaaaaaaaaaaaaaaaaaaaaaaaa

Figure 6. Effect of variations in Tachikawa number

First consider the effect of changing Tachikawa number, Ta – see Figure 6. This represents changes in the nature of the debris. A low value of Ta represents heavy debris and vice versa. It can be seen that at low values of Ta, the debris tracks can reach significant heights and the debris undergoes a diverging motion when viewed in the radius / height plane, with a diverging kinetic energy oscillation. At some point in the trajectory the debris hits the ground and the energy falls to zero. The base case situation at Ta = 100 is still mildly diverging but the trajectory does not intersect the ground plane for the length of the calculation. As Ta increases further, the debris takes up a stable path in the radius / height plane travels around a small circular trajectory, with the kinetic energy converging to a stable value. This suggest that light debris can reach an equilibrium where it is held aloft by the tornado. The position around which the circular motion takes place is around a normalized radius of 1.3 and a normalized height of 0.9. The value of height is much less than calculated in the 2017 paper, reflecting the fact that the vertical velocity does not decrease indefinitely with height for the new model as it did in the old.

aaaaaaaaaaaaaaaaaaaaaaaaaaaaaaaaaaaaaaaaaaaaaaaaaaaaaaaaaaaaaaaaaaaaaaaaaaaaaaaaaaaaaaaaaaaaaaaaaaaaaaaaaaaaaaaaaaaaaaaaaaaaaaaaaaaaaaaaaaaaaaaaaaaaaaaaaaaaaaaaaaaaaaaaaaaaaaaaaaaaaaaaaaaaaaaaaaaaaaaaaaaaaaaaaaaaaaaaaaaaaaaaaaaaaaaaaaaaaaaaaaaaaaaaaaaaaaaaaaaaaaaaaaaaaaaaaaaaaaaaaaaaaaaaaaaaaaaaaaaaaaaaaaaaaaaaaaaaaaaaaaaaaaaaaaaaaaaaaaaaaaaaaaaaaaaaaaaaaaaaaaaaaaaaaaaaaaaaaaa

Figure 7. Effect of variations in Froude number

The effect of variations in Froude number is shown in Figure 7. The primary effect that increase in Fr has is to increase the centrifugal force on the debris. At low values, the trajectories are stable and similar to that of the base case. As the values increase above 1.0 the oscillations become larger due to the increased centrifugal forces and eventually become unstable, with the trajectories meeting the ground at high values.

aaaaaaaaaaaaaaaaaaaaaaaaaaaaaaaaaaaaaaaaaaaaaaaaaaaaaaaaaaaaaaaaaaaaaaaaaaaaaaaaaaaaaaaaaaaaaaaaaaaaaaaaaaaaaaaaaaaaaaaaaaaaaaaaaaaaaaaaaaaaaaaaaaaaaaaaaaaaaaaaaaaaaaaaaaaaaaaaaaaaaaaaaaaaaaaaaaaaaaaaaaaaaaaaaaaaaaaaaaaaaaaaaaaaaaaaaaaaaaaaaaaaaaaaaaaaaaaaaaaaaaaaaaaaaaaaaaaaaaaaaaaaaaaaaaaaaaaaaaaaaaaaaaaaaaaaaaaaaaaaaaaaaaaaaaaaaaaaaaaaaaaaaaaaaaaaaaaaaaaaaaaaaaaaaa

Figure 8. Effect of variation in Swirl Ratio

The effects of variations in the Swirl ratio shown in Figure 8 are complex, with diverging trajectories (and ground impact) at both low and high values, and a region of stable trajectories between values of around 1.0 to 1.9. At low values the trajectories are destabilized by the high values of radial velocity, and at high values are destabilized by high values of the circumferential velocity.

aaaaaaaaaaaaaaaaaaaaaaaaaaaaaaaaaaaaaaaaaaaaaaaaaaaaaaaaaaaaaaaaaaaaaaaaaaaaaaaaaaaaaaaaaaaaaaaaaaaaaaaaaaaaaaaaaaaaaaaaaaaaaaaaaaaaaaaaaaaaaaaaaaaaaaaaaaaaaaaaaaaaaaaaaaaaaaaaaaaaaaaaaaaaaaaaaaaaaaaaaaaaaaaaaaaaaaaaaaaaaaaaaaaaaaaaaaaaaaaaaaaaaaaaaaaaaaaaaaaaaaaaaaaaaaaaaaaaaaaaaaaaaaaaaaaaaaaaaaaaaaaaaaaaaaaaaaaaaaaaaaaaaaaaaaaaaaaaaaaaaaaaaaaaaaaaaaaaaaaaaaaaaaaaaa

Figure 9 Effect of variations in gamma

The change in values of gamma from the one cell form of gamma = 2 to the quasi-two cell form of gamma = 4 shown in Figure 9 results in little change to the debris trajectories from the base case, although the oscillations in the kinetic energy fall as gamma increases.

aaaaaaaaaaaaaaaaaaaaaaaaaaaaaaaaaaaaaaaaaaaaaaaaaaaaaaaaaaaaaaaaaaaaaaaaaaaaaaaaaaaaaaaaaaaaaaaaaaaaaaaaaaaaaaaaaaaaaaaaaaaaaaaaaaaaaaaaaaaaaaaaaaaaaaaaaaaaaaaaaaaaaaaaaaaaaaaaaaaaaaaaaaaaaaaaaaaaaaaaaaaaaaaaaaaaaaaaaaaaaaaaaaaaaaaaaaaaaaaaaaaaaaaaaaaaaaaaaaaaaaaaaaaaaaaaaaaaaaaaaaaaaaaaaaaaaaaaaaaaaaaaaaaaaaaaaaaaaaaaaaaaaaaaaaaaaaaaaaaaaaaaaaaaaaaaaaaaaaaaaaaaaaaaaa

Figure 10. Effect of variations in radial starting position

aaaaaaaaaaaaaaaaaaaaaaaaaaaaaaaaaaaaaaaaaaaaaaaaaaaaaaaaaaaaaaaaaaaaaaaaaaaaaaaaaaaaaaaaaaaaaaaaaaaaaaaaaaaaaaaaaaaaaaaaaaaaaaaaaaaaaaaaaaaaaaaaaaaaaaaaaaaaaaaaaaaaaaaaaaaaaaaaaaaaaaaaaaaaaaaaaaaaaaaaaaaaaaaaaaaaaaaaaaaaaaaaaaaaaaaaaaaaaaaaaaaaaaaaaaaaaaaaaaaaaaaaaaaaaaaaaaaaaaaaaaaaaaaaaaaaaaaaaaaaaaaaaaaaaaaaaaaaaaaaaaaaaaaaaaaaaaaaaaaaaaaaaaaaaaaaaaaaaaaaaaaaaaaaaa

Figure 11. Effect of variations in vertical starting position

The debris trajectories remain stable as the normalized radius varies between 1 and 1.9 but outside those limits the trajectories diverge and intersect with the ground (Figure 10). Similarly the trajectories are only stable for normalized values for height between 0.8 and 1.2 (Figure 11). Thus the starting point window for the trajectories to ultimately attain a stable form is quite small.

Concluding remarks

A number of points arise from the results presented above.

  • Even for the simple wind and debris flight formulation adopted, debris trajectories can be quite complex.
  • A comparison of the results obtained with the old and the new wind field model show very considerable differences, due to the different vertical velocity formulation. analysis reveals that the debris trajectories can be specified by a small number of debris and tornado parameters, with the Tachikawa number and the Swirl Ratio being the most significant.
  • There are regions within parameter space for which the debris trajectories become stable – i.e. the debris flies indefinitely.

Pollution, Covid and Trains

Voyager at Birmingham New Street

There has been a significant amount of research recently to investigate the air quality in railway stations. Perhaps the major study, with which I was very much involved, involved extensive measurements of the air quality at Birmingham New Street by colleagues at the University of Birmingham (Figure 1). Measurements were made of the oxides of nitrogen (NOX) and particulate matter (PM) and concentrations were measured that were considerably in excess of Environmental Health limits. Typical daily average results are shown in Figure 2. This work informed the efforts by Network Rail to improve the air quality at the station through an improved ventilation system. Further work was carried out by Kings College London and Edinburgh University, under an RSSB contract, to measure NOX and PM at Kings Cross in London and Edinburgh Waverley. Typical results are shown in figure 3 and although these results are not as extreme as the Birmingham measurements, do show some exceedances of environmental health limits. Between them, these three investigations have given a great deal of information on station air quality and informed methods for alleviating the worst of the effects.

Figure 1. Air quality measurements at Birmingham New Street
Figure 2. Daily pollutant levels at Birmingham New Street (red lines show EU limits)
Figure 3 Comparison of pollutant levels at New Street, Kings Cross and Edinburgh Waverley

However, that is not the whole story. There are growing indications that air quality ON trains is also very poor. A study on diesel commuter stock in Canada has shown high levels of ultrafine particles and black carbon within the passenger cabins (Figure 4). In 2016 the BBC reported the measurements made by their reporter Tim Johns  as he commuted into London, which again showed high particulate levels on diesel commuter trains, although not as high as in Black Cabs (Figure 5). Similarly, the BBC in 2019 reported a study by the Committee on the Medical Effects of Air Pollutants which showed very high levels of particulates on the London underground (Figure 6) which resulted in a strong response from the rail unions. These high levels are presumably due to two sources – diesel particulate emissions from trains being ingested into air conditioning systems, and also from ambient particulates in the dirty tunnels of the underground. The levels of particulates measured have significant implications for human health, particularly for those with respiratory conditions.  

Figure 4. Air Quality measurements on Canadian trains
Figure 5. Particulate measurements by BBC Reporter
Figure 6. BBC report on Underground particulate levels

Similarly, some work has been recently reported from Greece that shows elevated levels of both gaseous pollutants and particulate pollutants on diesel trains, both in excess of EU limits (Figure 7). Again this is presumably due to ingestion of diesel emissions by ventilation systems. Hopefully in the near future we will see the results of more quantitative investigations for the UK of on train NOX and particulate concentrations, and of work to investigate the ingestion of external pollutants, both from diesel emissions and dirty environments, by ventilation systems. However current indications are, that, care should be taken in using ventilations systems that draw external air into the train without the use of extensive filtering of the input.

Figure 7. NOX measurements on Greek train (red line is EU limit)

And then along comes Covid-19. The importance of high levels of ventilation on reducing pathogen concentrations and thus the risk of infection is becoming clear – se for example the recent seminar organized by the University of Birmingham. Ideally, very high (airline) levels of air exchange with the outside are required in internal environments, including trains and buses. An interesting illustration of this is provided by the publicity material in figure 8 produced by SNCF in France. I have seen nothing similar for the UK. There is an obvious dichotomy here between the need to reduce external air intake to minimize NOX and PPM ingestion and to keep internal levels of NOX and particulates at an acceptable level, and the need to increase ventilation rates to decrease pathogen levels. Both could be achieved by aggressive filtration of the air drawn through the train. However, this is likely to require major modification to existing trains in Britain, that won’t be cheap. I suspect train ventilation is going to become a major issue in the near future.

Figure 8. SNCF publicity material

A historical curiosity – Fog Cottages

The original Lichfield Trent Valley station

Next to the original Lichfield Trent Valley station (north if the current one – see my blog post at https://profchrisbaker.com/…/lichfield-trent-valley…/ ) the OS map of 1900 shows a row of cottages that the census return names as Fog Cottages as shown in figure 1 below.

Figure 1. Lichfield Trent Valley 1900 OS map

I noticed recently whilst out walking that there is another similarly named row of cottages just beyond Rugeley Trent Valley station. This is not shown on the 1900 map, but is there on the 1920 map, again shown on Figure 2.

Figure 2. Rugeley Trent Valley 1920 OS Map

The Staffordshire Past Track website has a picture of these cottages at https://www.search.staffspasttrack.org.uk/Details.aspx… with the following explanation for the name.

“A postcard view of Fog Cottages, on the Colton Road near Trent Valley Station, Rugeley. They acquired the name Fog Cottages because the end cottage had an alarm bell installed and this was used in foggy conditions to call out the railway men who lived in the cottages to go and place fog detonator alarms on the nearby rails to assist the train drivers.”.

A modern view of the Rugeley Cottages (from Google Street View) is shown in Figure 3 below.

Figure 3. Fog Cottages, Rugeley

The question then arises as to whether the name of Fog Cottages has more widespread use. And the answer is that it does. Mathams and Keshall (2014) present an old photograph of a now demolished set of Fog cottages at Amington, next to the LNWR line north of Tamworth (Figure 4).

Figure 4. Fog Cottages Amington (Mathams and Keshall, 2014)

Rightmove (perhaps one of the more unusual historical sources!)  reveals that there are Fog Cottages at Watford, Collingtree and Althorp Parkin Northamptonshire and at Tring in Hertfordshire (see the Google Street View shots of these in figure 5). There are almost certainly more that I have not identified. All are next to the LNWR line, but only some are near stations or the sites of former stations. On the Amington Cottages Mathams and Keshall write

The LNWR standard cottages were built after 1883 when the design was introduced by Francis Webb, Chief Engineer of the LNWR and later examples – built after 1883/4 – are recognisable by the courses of stepped-out brickwork on the gable ends and under the eaves, and the four red-brick bands which run round the building in line with window sills and lintels, all of which can be seen in the picture below.  Nearly everything (except the slates) came from the LNWR works at Crewe;  bricks, woodwork and metal fittings.  

I can find no mentions of Fog Cottages other than in LNWR territory so it looks as if we have here a specifically LNWR naming policy. But if there are any occurrences away from the LNWR I would be pleased to be told.