Preamble
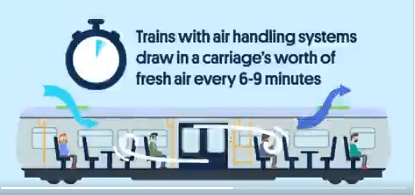
In a recent post I looked at the ventilation rate of trains without air conditioning and compared them with the ventilation rate of airconditioned trains. The context was the discussion of the safety of trains in terms of Covid-19 infection. For air conditioned trains, the industry accepted number of air changes per hour is around 8 to 10. For non-air conditioned trains with windows fully open and doors opening regularly at stations, I calculated very approximate values of air changes per hour of around twice this value, but for non-air conditioned trains with windows shut and thus only ventilated by door openings, I calculated approximate values of a of 2.0. On the basis of these calculations, I speculated that the non-air conditioned trains with windows shut probably represented the critical case for Covid-19 transmission. In that post however I was unable to be precise about the level of risk of actually becoming infected and how this related to ventilation rate.
The work of Jimenez
I have recently come across the spreadsheet tool produced by Prof. Jose Jimenez and his group at the University of Colorado-Boulder that attempts to model airborne infection rates of Covid-19 for a whole range of different physical geometries, using the best available information on pathogen transport modelling, virus production rates, critical doses etc. They base their analysis on the assumption that aerosol dispersion is the major mode of virus transport, which now seems to be widely accepted (and as anyone who has been following my blogs and tweets will know that I have been going on about for many months). I have thus modified the downloadable spreadsheet to make it applicable to the case of a standard GB railway passenger car compartment. A screen shot of the input / output to the spreadsheet is shown in figure 1 below.
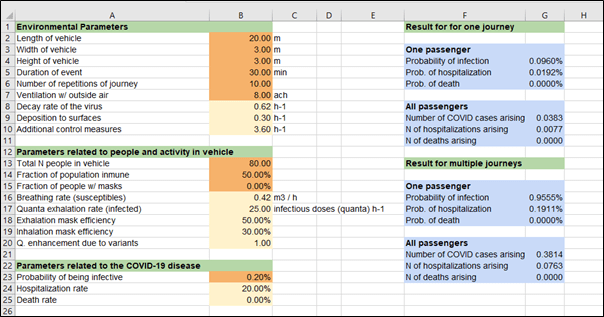
Figure 1 Screen shot of spreadsheet input / output parameters
The inputs are the geometry of the passenger compartment; the duration and number of occurrences of the journey, the air conditioning ventilation rate; the number of passengers carried; the proportion of the population who may be considered to be immune; the fraction of passengers wearing masks; and the overall population probability of an individual being infected. In addition, there are a number of specified input parameters that describe the transmission of the virus, which the authors admit are best guess values based on the available evidence, but about which there is much uncertainty. The outputs are either the probabilities of infection, hospitalization and death for an individual on a specific journey or for multiple journeys; or the number of passengers who will be infected, hospitalized or die for a specific journey or for multiple journeys.
The spreadsheet is a potentially powerful tool in two ways – firstly to investigate the effect of different input parameters on Covid-19 infection risk, and secondly to develop a rational risk abatement process. We will consider these in turn below.
Parametric investigation
In this section we define a base case scenario for a set of input variables and then change the input variables one by one to investigate their significance. The base case is that shown in the screen shot of figure 1 – for a journey of 30 minutes repeated 10 times (i.e. commuting for a week); 80 unmasked passengers in the carriage; a ventilation rate of 8 air changes per hour; a population immunity of 50%; and a population infection rate of 0.2% (one in 500). The latter two figures broadly match the UK situation at the time of writing. For this case we have a probability of one passenger being infected on one journey of 0.096% or 1 in 1042. The arbitrariness of this figure should again be emphasized – it depends upon assumed values of a number of uncertain parameters. We base the following parametric investigation on this value. Nonetheless it seems a reasonable value in the light of current experience. The results of the investigation are given in Table 1 below.

Table 1 Parametric Investigation
The table shows the risk of infection for each parametric change around the base case and this risk relative to the base case. There is of course significant arbitrariness in the specification of parameter ranges. Red shading indicates those changes for which the infection risk is more than twice the value for the base case and green shading for those changes for which the infection risk is less than half the value for the base case. The following points are apparent.
- The risk of infection varies linearly with changes in journey time, population infection rate and population immunity. This seems quite sensible, but is effectively built into the algorithm that is used.
- Changes in ventilation rate cause significant changes in infection risk. In particular the low value of 2ach, which is typical on non-airconditioned vehicles with closed windows, increases the infection risk by a value of 3.5.
- The effect of decreasing passenger number (and thus increasing social distancing) is very significant and seems to be the most effective way of reducing infection risk, with a 50% loading resulting in an infection risk of 28% of the base case, and a 20% loading a risk of 6% of the base case.
- The effect of 100% mask wearing reduces the infection risk to 35% of the base case.
- 100% mask wearing and a 50% loading (not shown in the table) results in a reduction of infection risk to 10% of the base case.
From the above, regardless of the absolute value of risk for the base case, the efficacy of reducing passenger numbers and mask wearing to reduce risk is very clear.
An operational strategy to reduce risk.
The modelling methodology can also be used to develop a risk mitigation strategy. Let us suppose, again arbitrarily, that the maximum allowable risk of being infected per passenger on the base case journey is 0.1% (i.e. 1 in a thousand). Figure 2 shows the calculated infection risk for a wide range of national infection rate of between 0.01% (1 in 10,000) to 2% (1 in 50). Values are shown for no mask and full capacity; 100% mask wearing and full capacity; and 100% mask wearing and 50 % capacity. It can be seen that the no mask / full capacity curve crosses the 0.1% line at a national infection rate of 0.2% and the 100% mask / full capacity line crosses this boundary at 0.6%.
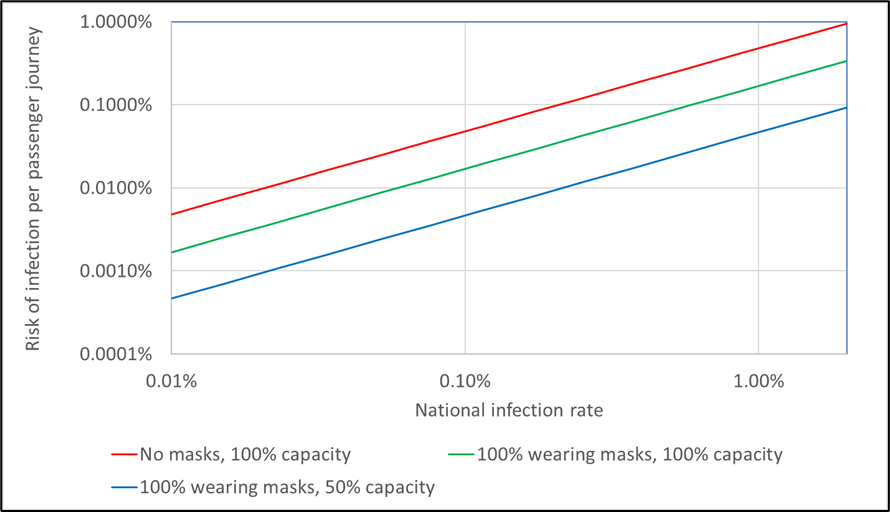
Figure 2 Effect of national infection rate on infection risk, with and without mask wearing and reduction in loading
Consideration of the results of figure 2 suggest a possible operational strategy of taking no mitigation risks below an infection rate of 0.2%, imposing a mask mandate between 0.2% and 0.6% and adding a significant capacity reduction above that. This is illustrated in figure 3 below.

Figure 3. Mitigation of risk to acceptable level through mask wearing and reduced capacity.
As has been noted above the absolute risk values are uncertain, but such a methodology could be derived for a variety of journey and train types, based to some extent on what is perceived to be safe by the travelling public. Regional infection rates could be used for shorter journeys. Essentially it gives a reasonably easily applied set of restrictions that could be rationally imposed and eased as infection rate varies, maximizing passenger capacity as far as is possible. If explained properly to the public, it could go some way to improving passenger confidence in travel.

One thought on “The calculation of Covid-19 infection rates on GB trains”