The first Mercian Lands

First published on this site as a web age in June 2020, but republished as a blog post in august 2024 for consistency with other material.

Preamble

The Tribal Hidage, that most enigmatic of early texts, begins its perambulation of the polities in Southern England with a reference to “the first (or original) Mercian lands” (Davies and Vierck, 2010). It is the purpose of this short essay to unpack this phrase, and to see if it is possible to arrive at a coherent description of what was the original Mercia in the early / mid seventh century when, it will be seen, I take the Tribal Hidage to have been composed. We begin by briefly considering some aspects of the Tribal Hidage itself and then move on to a discussion of what can be deduced about early “kingdom” boundaries in the period of late antiquity – although the nature of the different polities discussed may well be very different from one another – through a consideration of detailed reconstructions from studies of regional history, and through consideration of ecclesiastical diocesan boundaries.  We then discuss what might have been the nature of this early Mercian kingdom, through a consideration of the likely transport networks in its confines, and considers the historical events surrounding its establishment. 

Throughout, we will work with what seems to be the developing consensus that it is difficult to separate Anglian, Saxon and British kingdoms on a strict ethnic basis, and most of the polities discussed will be of an ethnic mix, although it is clear that in the period of late antiquity following the withdrawal of the Roman armies, there was an increasing Germanic cultural influence throughout England, perhaps involving a relatively small migration from the Anglian and Saxon homelands. Such an approach seems to be consistent with recent archeological studies, which shows no major discontinuities in agricultural practices or evidence of major warfare in the early settlement period (Oosthuizen, 2017), and with recent genetic studies that show a homogeneous genetic background across most of England, although a genetic boundary between England Wales is apparent, and second level genetic differences can be observed in the South West, and in South Yorkshire (Lesley et al, 2015). 

In what follows, an essentially geographical analysis will be presented in an attempt to locate the original Mercia, based on the drawing of boundaries of different types – kingdom boundaries, diocesan boundaries and county boundaries. Most of these are not contemporary with the period under consideration, and there is an implicit assumption that these boundaries reflect underlying and ancient boundaries from late antiquity. Whilst others have followed this route it is a somewhat dangerous course and open (quite rightly) to significant criticism. Also of course the concept of a boundary between peoples may or may not have been of relevance in the period under consideration and this needs to be borne in mind in what follows. These points having been made, we will in what follows use two scales of maps that both show, as the basis for relating to current geography, the pre-1974 county boundaries (see figure 1 for the larger scale of map that will be used). These counties were first defined in the 10thcentury, and remained relatively stable up to the 1974 re-organisation, although there have been continual minor modifications to boundaries over the centuries. In the area shown in figure 1, this has particularly affected the boundaries of Worcestershire, which became fragmented as a result of transfers of property from secular to ecclesiastical ownership and vice versa, with detached areas in the surrounding counties. These areas are not shown in figure 1 for clarity.  There is one region however where the pre-1974 boundaries are not shown – the county boundary between the south west of Staffordshire and Shropshire – where there was an early (12thcentury) loss of land from Staffordshire to Shropshire due to the actions of Earl Roger to consolidate all his holdings into Shropshire (Thorn et al, 1986). As this region is particularly pertinent to the discussion that will follow, the Domesday boundaries for this region will be shown in all the maps that follow. 

Figure 2 uses this map to illustrate the river systems in the English Midlands – and in particular the Trent, Severn, Wash and Cheshire basins. It is clear that the county boundaries in general follow river basin boundaries. In the area of interest here, this is particularly the case for the Staffordshire / Cheshire, Shropshire / Cheshire and Staffordshire/ Shropshire boundaries. The southern Severn / Trent basin boundary is also coincident with county boundaries, except in the case of Warwickshire which sits across the watershed between them.  
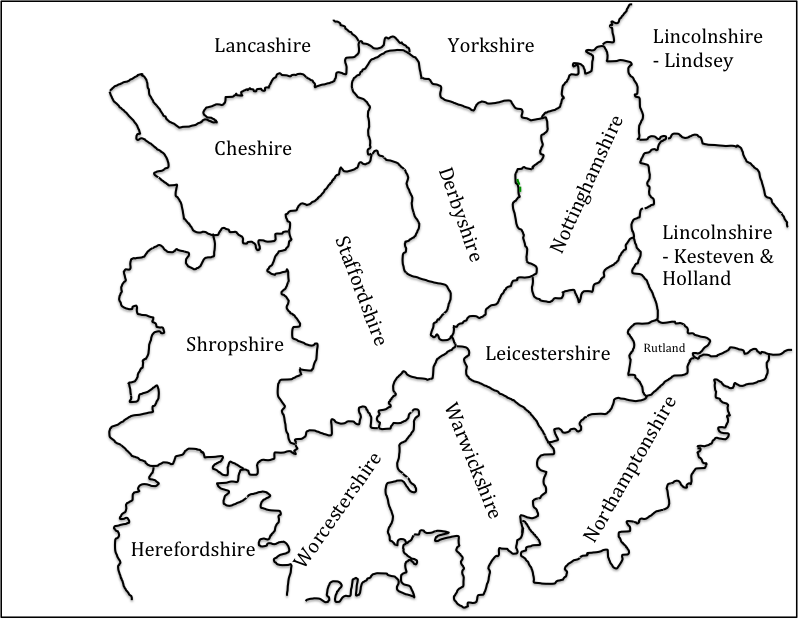
Figure 1. The base map, showing pre-1974 county boundaries and names 
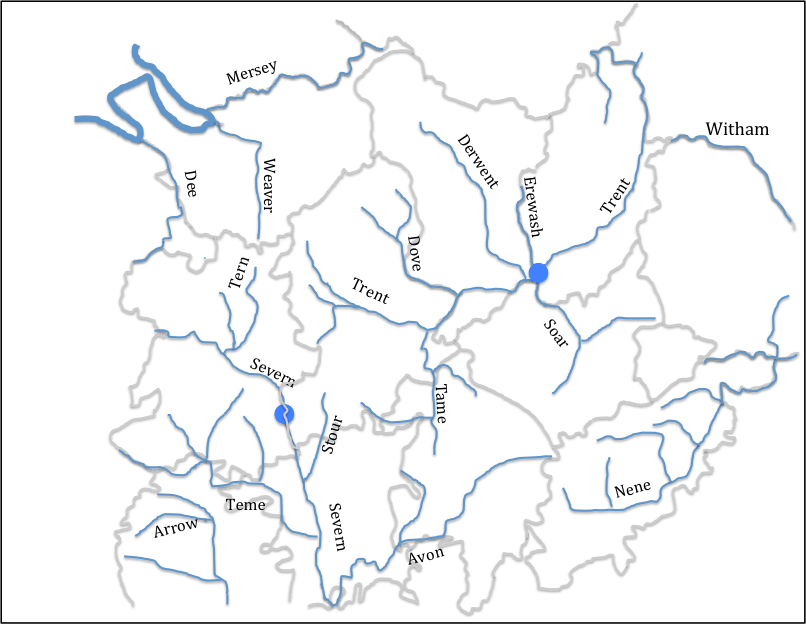
Figure 2 Rivers and county boundaries 

(Only major rivers and tributaries are shown. The blue filled circles indicate riverine locations of importance to the argument that follows below.)

The Tribal Hidage

The Tribal Hidage exists today in a number of different manuscripts, which are set out and compared by Dumville (1989).  It essentially consists of two lists of kingdoms / polities of various sizes, with hidages attached to each entity. The date of the original document is disputed, with dates from the 620s to the 780s suggested (Corbett, 1900; Hart, 971; Higham 1995). I find the approach taken by Higham (1995), who proposes date in the 620s, the most persuasive, although this does not appear to be the universal view of historians. He suggests that it is in origin a tribute list of Edwin of Deira, dating from 624/5. The primary list is effectively a list of tributes payable to him from what Higham terms the Midlands “Overkingship”, whilst the secondary list was added perhaps a year later to indicate the tribute from the Southern “Overkingship”. The level of hidage seems to be standardized to 7000 for county sized entities, and to multiples of 300 for smaller entities particularly in the region know as Middle Anglia around the Wash and the East Midlands. For the Southern Overkingship entries in the secondary list, there is clearly a punitive element, particularly with the 100,000 hides allocated to Wessex.  

For the current purposes it is the order of the entries that is of most interest. The kingdoms on which most authors can agree are shown in figure 3 for both the primary (P) and secondary  (S) lists.  Original Mercia (P1 on the figure) is placed at the historic centre of the kingdom in south Staffordshire around Lichfield and Tamworth. A number of points arise from this figure.

  • There is a well-described clockwise progression in the primary list (and a subsidiary clockwise progression in the Fenland entities – based on the recent wok of Osthuizen (2017) and similarly in the secondary list. The latter list is indeed almost a closed loop. This is so marked, it seems to have been a specific intention on the part of the original compiler of the list. 
  • The list includes Elmet, which was incorporated into the Deiran kingdom by Edwin (i.e. before 633) and Lindsey and Hatfield, which were never associated as a dual entity after the reign of Edwin. This argues for an early date for the Hidage (Higham, 1995).
  • The list does not include the Magonsaete in the south Shropshire / Herefordshire region, which was certainly in existence by 680 when it was ruled by Merewalh (note the British name), who is described by some as a son of Penda of Mercia. Again this argues for an early date (Pretty, 1989).
  • The area of Leicestershire and Northamptonshire, which the diocesan boundaries suggest is in Middle Anglia (see below) are not allocated any of the agreed kingdoms on the Tribal Hidage map. This suggests to me that the Noxgaga (P18) and Ohtgaga (P19) at the end of the primary list, both county sized entities, should be located in this area, rather than in the Middlesex / Surrey area suggested by some authors (Hart, 1977). This identification would make the primary list an almost closed loop. 
  • This identification identifies the area around which the primary list loops to be in the Nottinghamshire area. This will be seen to be of relevance in what follows. 
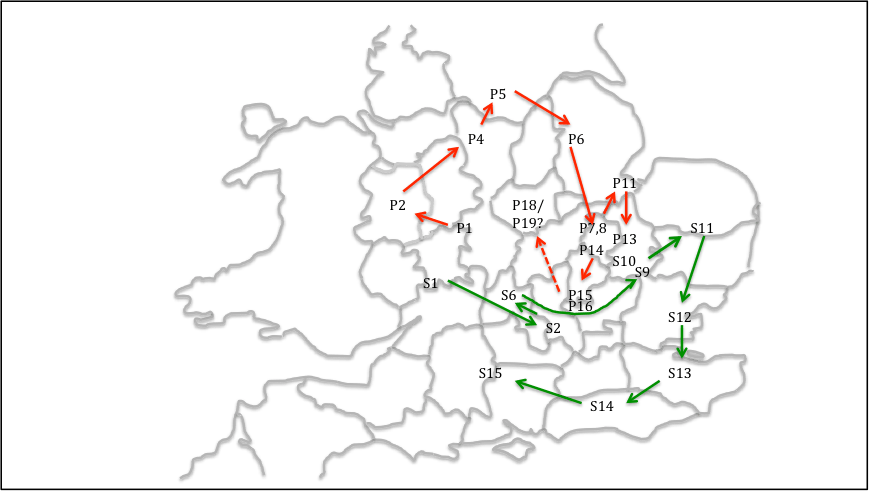
Figure 3. Tribal Hidage. “Firm” locations of regions in the primary and secondary lists 

(P1- Myrcna lands; P2 – Wocensætna; P4- Pecsætna: P5 – Elmedsætna: P6 – Lindesfarona mid Hæþfeldlande: P7 – Suþgyrwa: P8 – Norþgyrwa: P11 – Spalda; P13 – Herefinna : P14 – Sweordora P15 – Gifla : P16- Hicca: P18- Noxgaga: P19 – Ohtgaga; S1 – Hwinca; S2 – Cilternsætna; S6 – Færpinga; S9 – Eastwilla; S10 – Westwilla; S11 – Eastengle; S12 – Eastsexena; S13 – Cantwarena; S14 – Suþsexena; S15 – Westsexena)

Kingdom and Diocesan boundaries

The work of local historians in various parts of England, who have carried out detailed work on boundaries of sub-Roman, early Anglo-Saxon polities that enables the boundaries of these polities to be drawn in more detail than the Tribal Hidage allows, even though these are to some extent speculative. Here we consider the work of Higham for the Pecsaetna in the Peak (Higham, 1993), Breeze for Elmet in South Yorkshire (Breeze, 2002), Parker for Hatfield in South Yorkshire / North Nottinghamshire (Parker, 1992) and Bassett for the kingdom of Lindsay (Bassett, 1989), All of these authors would, I am sure, have significant caveats for their work, but taken together they form a useful set of data. The boundaries they identify are again shown on figure 4. Higham suggests that the area of the Pecsaete consist of the Cheshire Domesday hundred of Hamestan, the Derbyshire hundred of the same name, plus the Staffordshire hundred of Totmonslow. The area of Hadfield identified by Parker includes not only the area of south Yorkshire that is usually so identified, but also north Nottinghamshire. The boundaries of the Pecsaete and Hatfield are, on this basis separated by a thin strip of Derbyshire (essentially Scarsdale Hundred), and it seems likely that the territory of one or the other of them extended to fill the gap between them. We choose here to extend the region of the Pecsaete into this area, as it will be seen below that a significant diocesan boundary separates Derbyshire from Nottinghamshire.  Elsewhere the region of Elmet identified by Breeze can be seen to border on the Pecsaete, and the area of Lindsey is, following Bassett, taken to include not only the pre-1974 Parts of Lindsey to the north of the River Witham, but also a similar sized area to the south.
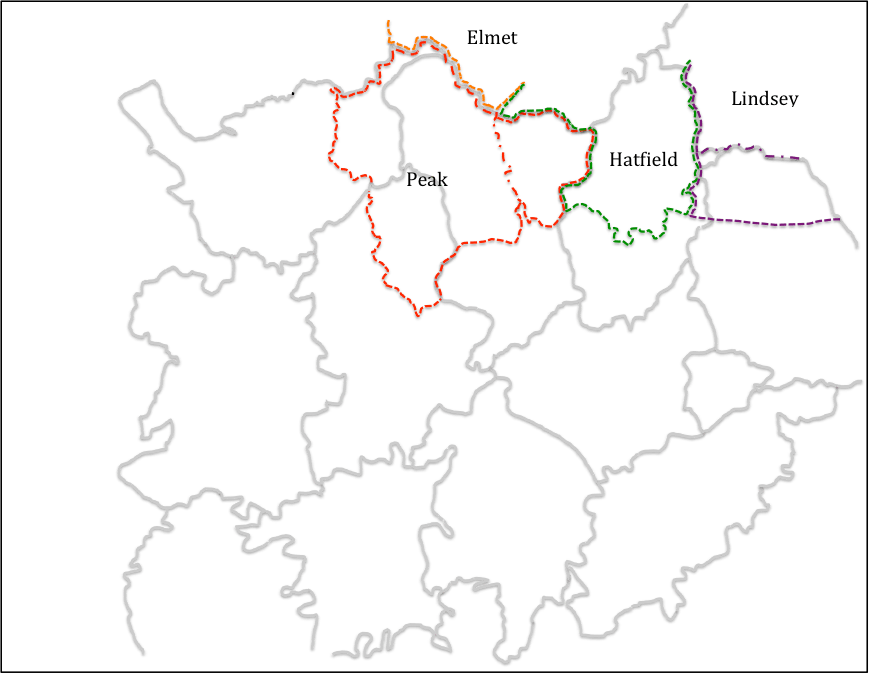
Figure 4 Kingdom boundaries in the north Midlands

(red dotted line shows the region of the Pecsaetna assumed in what follows – the red chain dotted line ins the boundary identified by Higham; the green dotted line shows the region of Hatfield; the brown dotted line shows the region of Elmet; the purple dotted line shows the region of Lindsey – with the chain dotted line showing the southern boundary of the Parts of Lindsey)

Now let us move to the consideration of the boundaries of church dioceses, particularly in the English Midlands. Some historians have expressed doubt about how the known medieval boundaries can be extrapolated back to the seventh century, the period under consideration here. This is particularly true of those areas which fell within the Danelaw where a number of dioceses ceased to operate. Nonetheless, they are used here for two reasons – firstly the 10th century Midland county boundaries follow these diocesan boundaries in many places and this suggests that the latter predated the former, and secondly, in many parts of the Midlands, there seems to be no record of any historical events that could have led to boundary changes. This is indeed the approach followed by Hart (1977) in his consideration of the Tribal Hidage, although he did not follow this approach to its logical conclusion. 

The Mercian diocese came into existence in 655, and in its early days it covered a large region across the English Midlands. The situation changed with the reorganization of Theodore of Tarsus (Archbishop of Canterbury 669-690), who created dioceses based on “kingdoms” – a Lichfield diocese reduced in size for Mercia, Hereford Diocese for the Magonsaete (676), Lincoln diocese for the kingdom of Lindsey (678), Worcester diocese for the Hwicce (680) and Leicester diocese for the Middle Angles (681) (Podmore, 2008). These dioceses, as they existed in the late Anglo-Saxon era, are shown in figure 5, together with the relevant county boundaries (Ordnance Survey, ??).

From this figure it can be seen that the Mercian diocese covers much of west Warwickshire, Staffordshire, part of Shropshire, Derbyshire and the “land between the Mersey and the Ribble”.  Clearly as such it encompasses the areas listed in the Tribal Hidage as Wocensætna and Pecsaetna, as well as whatever polities existed north of the Mersey, which must thus have been incorporated into Mercia sometime between the compilation of the Tribal Hidage (in 625 if Higham’s argument is accepted) and the re-organisation of dioceses in the 670s.

Equally significant are those areas that are not part of the Mercian diocese. Firstly Nottinghamshire has been, from at least 956 when the church was re-established following the Danish conquests, part of the York diocese (Stenton, 1968). At this time the area based on the minster church of Southwell, which was granted to Oskytel, Archbishop of York by King Eadwig.  It seems likely to methat this was simply are-establishment of the pre-conquest status quo. There is a local tradition that the area was first evangelised in the early seventh century by Paulinus operating from York.  Thus, in ecclesiastical terms, Nottinghamshire looks to the north and the Humber, rather than to the Midlands and the diocese of Lichfield. Secondly, the counties of Leicester and Northamptonshire are in the Leicester (i.e. Middle Anglian) diocese. Hart, in his definition of the geography of Mercia, arbitrary labels this area as “outer Mercia” (Hart, 1977), an entity which has no historical context at all. The fact that it is regarded as being in Middle Anglia is consistent with the argument set out above that the Noxgaga and Ohtgaga should be located in this area. 

Figure 5 Diocesan and county boundaries.  

Locating the original Mercia 

An attempt can now be made at locating the original lands of Mercia, about which the Tribal Hidage seems to revolve – see figure 6. The diocesan boundaries and boundaries of other kingdoms would suggest that this region included west Warwickshire, south Staffordshire and south and east Derbyshire. The main unknowns are the location of the northern and western boundaries. With regard to the northern boundary, this has been chosen to exclude the long neck of land between the regions of the Pecsaete and Hatfield, as identified by Higham and Parker, as this seems the more logical geographical boundary. The boundary shown in figure 6 thus forms the southern boundary of the Domesday Scarsdale Hundred.   With regard to the western boundary, the logical place for this would be on the watershed between the Trent and Severn basins. This is followed by the western border of Staffordshire, except for Seisdon hundred in the south, where part of the catchment of the Stour, a tributary of the Severn, is included within Staffordshire and the Domesday county boundary was the River Severn itself. The boundary of the original Mercia is drawn to follow the Staffordshire boundary even in this region for reasons that will become apparent below. The original Mercia thus consists of the Staffordshire Domesday hundreds of Seisdon, Cuttlestone, Pirehill and Offlow (the latter containing Lichfield), the Derbyshire hundreds of Walecross, Appletree, Litchurch and Morleystone and the Warickshire hundreds of Coleshill, Bumblelow, Stoneleigh, Marton and Hunesberi. Many authors have pointed out that this region lacks natural boundaries or defensive positions of any sort, and this will be considered below. But at this point the reason for the name of the kingdom – the borderlands – becomes obvious if this area is considered in terms of the Roman Civitas, the broad areas of which are also shown on figure 7 (it is not being possible to draw these with any precision) together with an indication of the Provincial areas following the reorganization of Diocletian (Jones and Mattingley. 1993). There is coming to be agreement that throughout the fifth and sixth centuries there was some continuity in Civitas level government, at least in the west of England, either through Governors or through kings (Dark, 2000). On the presumption that something similar to these Civitas continued to exist in some form into the late 6thcentury, it can be seen that the original Mercia sat across the borders of a number of them – the Dobunni in Worcestershire and Gloucestershire, who seem to have morphed into the Hwicce; the Cornovii in Shropshire / Chester, who became the Wocensætna, the Corieltauvi in Warwickshire / Leicestershire / Lincolnshire; the Catuvellauni in Northamptonshire / Bedforshire / Buckinghamshire, and, if it actually existed, Lutadorum in the Peak District, who can perhaps be identified with the territory of the  Pecsaete. It would seem that Mercia took land from all of these and straddled the borders of each, and in doing so straddled the borders of at least three of the four late Roman provinces. 
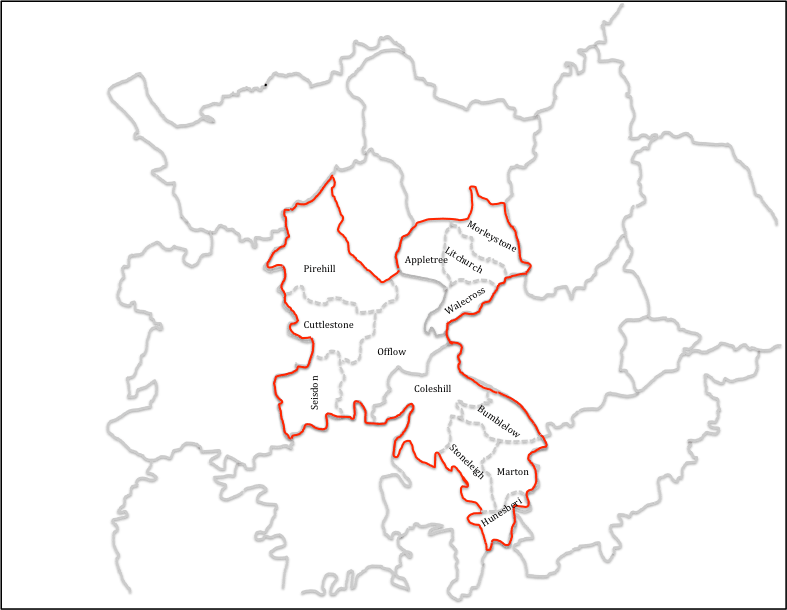
Figure 6. The original Mercia mapped.
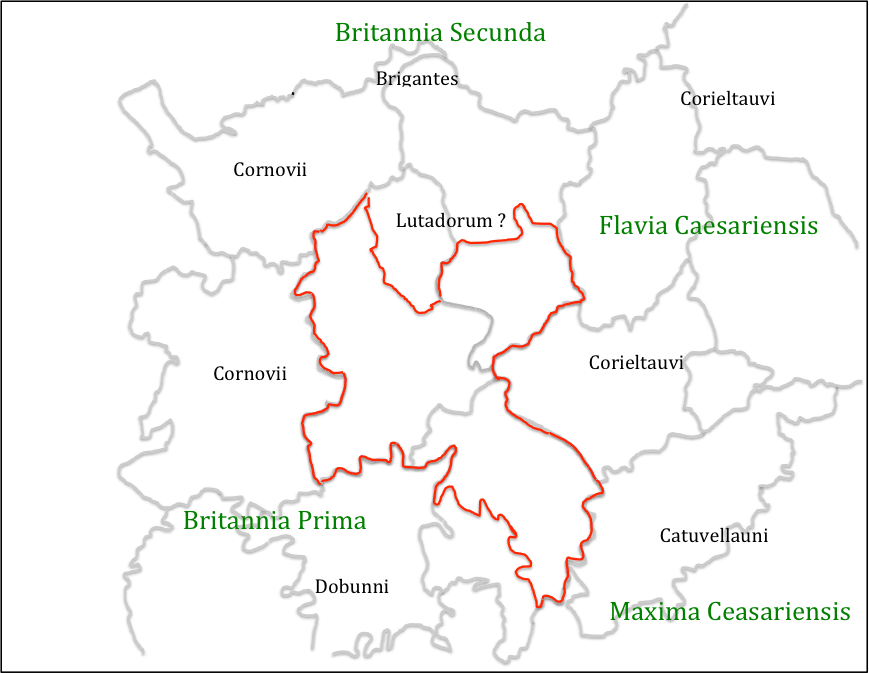
Figure 7. The original Mercia and Civitas and Provincial regions

(Civitas names in black, Provincial names in green)

The point has often been made that the original Mercia, whatever its precise location, lacked natural boundaries. However this is probably a misconception. Figure 8 shows the original Mercia as identified above, together with the established Roman road network, which was usable well into Medieval times, and also some conjectural, but likely roman roads. This changes the picture of Mercia significantly. It can be seen that the centre of the kingdom at Lichfield / Wall sits on a major junction of roads, from where small bands suitably mounted and armed could reach all parts of the kingdom very quickly and could establish control over a wide area.  Also at the borders there were at least the locations of Roman towns which could have acted as regional centres – Water Eaton to the west, Greensforge to the south west, Metchley to the south, High Cross to the south east and Derby to the north. Perhaps most importantly this network would also allow control of trade across the whole region – and thus control of major trading routes across England – Watling Street between High Cross and Water Eaton; Ryknield Streets between Derby and Metchley, as well as the northern saltways from Droitwich. To this road network, can be added strategic riverine locations at Sawley – the junction of the Trent, Erewash and Soar, and on the Severn at Quatford, which could thus control major river traffic flows. The latter is the major reason for suggesting that Seisdon hundred in Staffordshire was part of the orginal Mercia, as it gave control over the saltway at Greensforge and the roads to the borders and mid Wales, as well as access to the Severn at Quatford. This interpretation thus sees the original Mercia as very much a commercial enterprise as well as one in kingdom building.

Figure 8 – Communications networks

(blue indicates probably and possible Roman Roads; red indicates locations within the Original Mercia; green indicates major locations outside this area. Blue circles indicates the riverine crossings at Quatford (in the west) and Sawley (in the east)

Finally the question arises as to whether or not there is a historical context into which the above scenario could fit. Here there is little alternative but to use the evidence of the various chronicles and early histories, and which are open to serious challenges as to their veracity and utility. With that proviso, they are used and viewed as broadly reliable in what follows.

The third quartile of the sixth century was a time of expansion by the kingdom of Wessex, as illustrated in figure 9.  In 568 a Wessex force led by Ceawlin and Cutha, defeated Aethelberht of Kent, and pushed him back towards his homeland. In 571, in a northern advance, Cuthwulf defeated British force at Bedcanford (usually taken as Bedford) taking control of a number of towns in that region.  This was followed in 577 by the battle of Deorham, where three British kings were again defeated by Cuthwine and Ceawlin and three major towns taken – Bath, Glouccester and the capital of the Province of Britannia Prima, Circencester.  Then for 584, for  Anglo-Saxon chronicle reads

Ceawlin and Cutha fought with Britains at the place called Fethanleag and Cutha was killed, and Ceawlin took many townships and countless spoil and returned in anger to his own. 

Here Cutha is a king in Wessex, and Fethanleag has been identified as Stoke Lyne near Bicester in north Oxfordshire – a few miles south of the southern border of Mercia shown in figure 6.  Davies (1977) relates this to an entry for the next year in the Henry of Huntingdon’s Historia Anglorum which states 

585 Beginning of the kingdom of Mercia, with Crida

If one can make that equation, this suggest that Cutha met his match in an essentially British force that stopped the northern expansion of Wessex, and that this force was led by Crida who then went on to establish the kingdom of Mercia as outlined above, and a dynasty in the form of Crida, Pybba and Penda. Note the partially British name of the latter, which strongly suggests a kingdom of mixed ethnicity.  The dynasty was known as the Iclingas after the (perhaps mythical) ancestor Icel, and the Anglo Saxon Chronicle gives the names of his descendants before Crida as Cynewald and Cnebba. As noted by Myers there are a number of place names that reflect the name Icel across Suffolk, Cambridgeshire and Hertfordshire, and there is a concentration of names based on Pybba (Pedmore) and Penda (Pendford, Pinvin) in the Worcestershire / south Staffordshire area, suggesting the popularity of these names around there.

The nature of the original Mercia is however still elusive. It may be that Crida’s family of the 580s, simply took the region centred on Wall and held it by force of arms against the neighbouring polities. Dark would suggest that these polities were the remains of the sub-Roman Civitas system, which to the east were clearly (from the evidence of the small polities of the Tribal Hidage in the East Midlands) in the process of dissolution due to internal pressures, and perhaps also the pressure of migrating Saxons from the area around the Wash and the Humber; whilst in the west bureaucratic Civitas governments of the Dobunni and Cornovvii may well have been in their final sharp decline. This suggest the possibility (and it can be rated no higher than that) that the family and their followers were effectively foederatiemployed by these bureaucratic governments to resist the growing pressure of Wessex from the south and the chaos enveloping their eastern borders. If so, then their eventual subjugation by an expanding Mercia might suggest that this was ultimately not a good move. 

In the early seventh century, there does seem to have been a break in the succession, and Bede tells us of another Mercian king – Cearl – who took the refugee and later Deiran King, Edwin, under his protection in around 605. Higham argues that he was the Midlands Overking at the time, able to resists the demands of Aethelfrith in Northumbria for the return of Edwin (Higham, 1995). The fact that Edwin was able to reach Cearl easily, and after Cearl’s death find refuge with Raedwald in East Anglia, strongly suggests that Ceorl’s activity was in the north midlands – perhaps in the south of Nottinghamshire which has been identified as an anomaly in diocesan terms. In this scenario, Cearl would have been of northern Anglian stock, but Bede would have referred to him as king of Mercia, because the region in which his power was centred was Mercian in Bede’s day. Taking this further one can perhaps see the primary list of the Tribal Hidage as a tribute list of Cearl, in which the punative 30,000 hides of the original Mercia reflected a recent takeover from the Icinglas dynasty that was not to prove permanent.  It can also be speculated that Ceorl’s territory was that of the North Mercians mentioned by Bede, with the original Mercia being South Mercia. In taking over Ceorl’s territory, Penda would thus become the first king to “separate the Mercians from the Northumbrians” as also noted by Bede. But here we are in the realms of speculation, and his must be only one of many possibilities of the situation on the ground in the early seventh century.
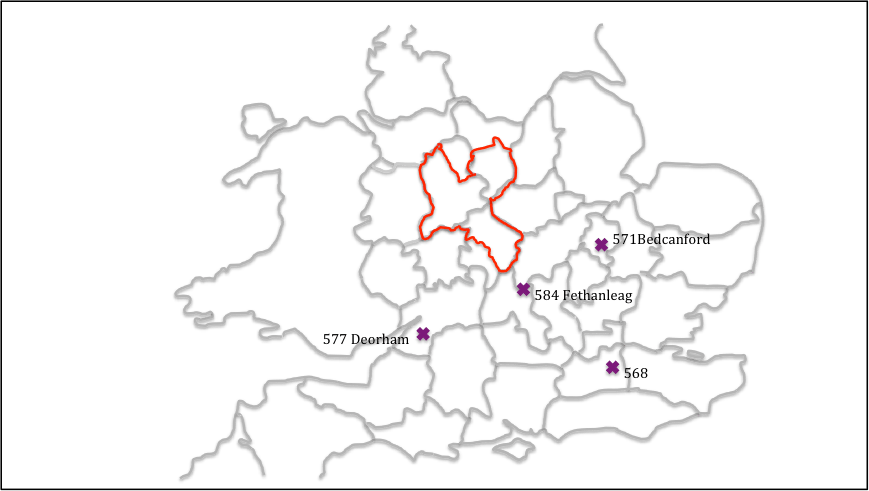
Figure 9 Anglo Saxon Chronicle battles of the mid / late sixth century

References

Bassett S (1989) “Lincoln and the Anglo-Saxon see of Lindsey”, Anglo-Saxon England, 18, 1-32

Breeze A (2002) “The Kingdom and Name of Elmet”, Northern History, 39, 2, 157-171

Brownbill J (1925) “The Tribal Hidage”, The English Historical Review, 40, 160, 497-503, Oxford University Press

Corbett W (1900) “The Tribal Hidage”, Transactions of the Royal Historical Society, New Series, 14, 187-230

Dark K (2000) “Britain and the End of the Roman Empire”, Tempus

Davies W (1977) “Annals and the origin of Mercia” in “Mercian Studies” edited by Ann Dornier, Leicester University Press

Davies W, Vierck H (2010) “The Contexts of Tribal Hidage; social aggregates and settlement patterns”, Frühmittelalterliche Studien

Dumville D (1989) “The Tribal Hidage: an introduction to its texts and their history”, in: Bassett, S (ed.), The origins of Anglo-Saxon kingdoms, Studies in the Early History of Britain, Leicester: Leicester University Press, 225–230, 286–287.

Hart C (1971) “The Tribal Hidage”,  Transactions of the Royal Historical Society, Fifth Series, 21 (1971), 133-157

Hart C (1977) “The kingdom of Mercia” in Mercian Studies, edited by Ann Dornier, Leicester University Press, 43-62  

Higham N (1993) “The origins of Cheshire”, Manchester University Press

Higham N (1995) “An English Empire – Bede and the early Anglo Saxon kings”, Manchester University Press.

Jones B, Mattingly D (1993) “An Atlas of Roman Britain”, Blackwell

Ordnace Survey (???)  “Monastic Britain”, South sheet, 2nd edition

Oosthuizen S (2017) “The Anglo-Saxon Fenland”, Windgather Press

Leslie S and 18 other authors (2015) “The fine-scale genetic structure of the British population”, Nature 519, 309-314

Parker M (1992) “The Province of Hatfield”, Northern History, 28, 1, 42-69, 

Podmore C (2008) “Dioceses and Episcopal Sees in England – A Background Report for the Dioceses Commission”, DC/R3

Pretty K (1989) “Defining the Magonsate” in: Bassett, Steven (ed.), The origins of Anglo-Saxon kingdoms, Studies in the Early History of Britain, Leicester University Press, 171-183

Stenton F (1968) “Anglo Saxon England”, The Oxford History of England, 2nd edition, Oxford University Press.

Thorn F, Thorn C (editors), Parker C (translator) (1986) “Domesday Book – Shrops
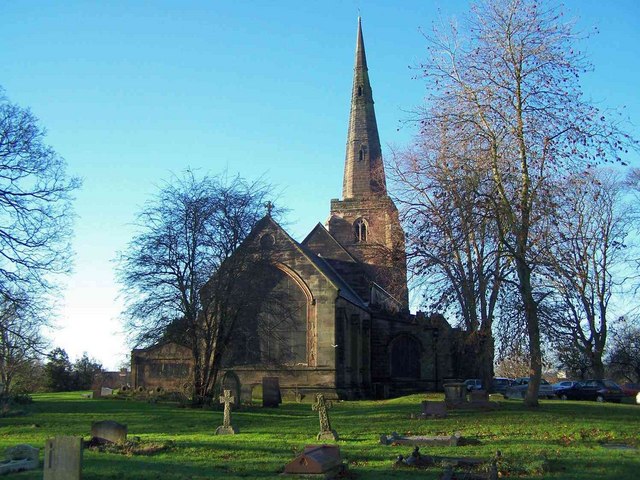
St. Michael’s, Lichfield in the 19th century. Part 2

St. Michael’s, Lichfield

Part 1 of this blog post can be found here.

Residence

The baptismal and burial registers allow the residence of the parents of the baptized child and those who have died to be identified, at least in broad terms. Neither measure can be regarded as an accurate measure of population, as the same couple may well figure more than once in the baptismal registers, and those who have died may not be long term residents of the parish. To investigate how this population is dispersed across the parish, we define the following districts.

Within the parish throughout the study period

  • Greenhill – the dense urban area close to St Michael’s church that extended up Burton Old Road and Trent Valley Road as the century progressed, together with its rural hinterland, broadly covering the area of the current Boley Park Estate.
  • St. Johns – based on the urban area around St. Johns Street (including, and south of St John’s Hospital) and the Birmingham Road, stretching south to the canal, with its rural hinterland in the Borrowcop and Berry Hill area. Note that the St. John’s and Greenhill as defined here did not have a direct road connection between their major centres for much of the study period, with journeys between them requiring a passage through St. Mary’s parish. 
  • The Workhouse on Trent Valley Road (the later St. Michael’s hospital).
  • The hamlet of Streethay to the north of the parish, including the development in the second half of the century of much railway activity around Trent Valley Station.
  • The rural hamlets of Freeford and Fulfen to the east of the parish. 

The out of parish townships

  • Burntwood, together with Edial and Woodhouses, which became a separate parish in 1820 with the opening of Christchurch, Burntwood.
  • Wall, which became a separate parish in 1845 following the opening of St. John’s Church in 1843.
  • Leamonsley to the west of the city which, with Pipe Hill, became the parish of Christchurch, Lichfield in 1848.

Out of parish districts

  • The parish of St. Mary Lichfield, including the extra-parochial areas of The Close and The Friary.
  • The parish of St. Chad, Lichfield
  • Any other out of parish location outside Lichfield.

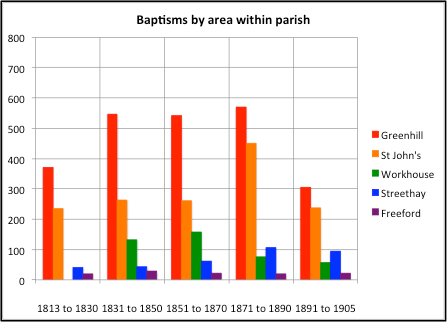
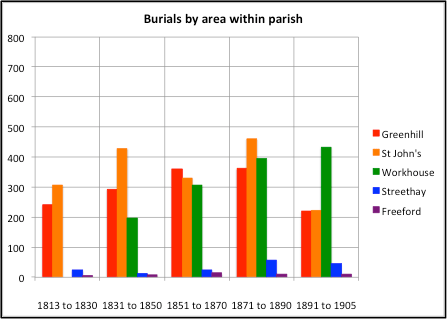
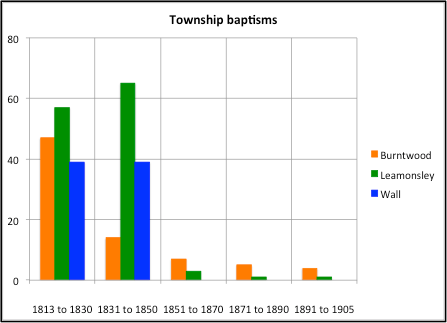
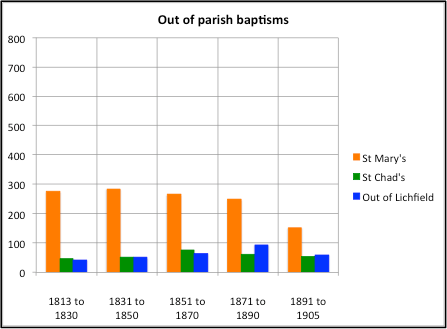
Figures 6 below shows the baptisms (on the left hand side) and burials (on the right hand side) for each of these three categories. These graphs show actual baptism numbers in (nominally) 20 year periods, rather than the number of baptisms per year. Note again that the first and last periods are somewhat shorter than 20 years.

Consider first the baptisms and burials in the different areas of the parish itself. For the former, the largest contributing area is Greenhill, with St. John’s the second largest. The situation is reversed for burials, perhaps indicating a rather younger population in the Greenhill area. The Workhouse baptisms and burials begin in the 1831 to 1850 period, as the Workhouse opened in 1840. In general the number of baptisms decrease with time, while the number of burials increase markedly, until in the period from 1891 to 1905 they are the single biggest number of burials. Both baptisms and burials increase over the century in Streethay, reflecting the growth of railway based activities there, whilst the figures fro the rural area of Freeford / Fulfen remain small and constant. 

The township baptisms and burials show a major fall after the chapels in the respective area are opened – 1820 for Burntwood, 1845 for Wall and 1848 for Leamonsley.  The baptism figures fall more dramatically than the funeral figures, suggesting that a number of township residents wished to be buried in family graves at St. Michael’s.

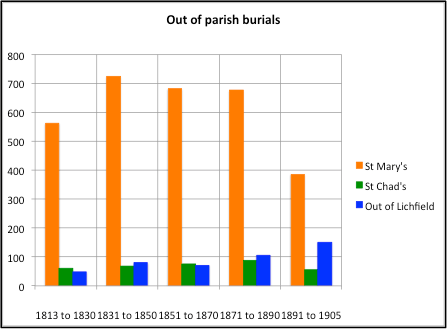
The out of parish baptisms and burials are interesting. There can be seen to be significant cross boundary baptisms of parishioners from St. Mary’s and St. Chad’s parish, presumably because of family or other historical connections. The number of burials for St. Mary’s parish was however very large, due to the fact that there was no graveyard there.  This imposed a considerable load on the clergy at St Michael’s (as will be seen below), In 1886 the Vicar of St. Mary’s agreed to conduct the funerals of his parishioners in St. Michael’s churchyard, but he stressed that by ancient custom it was the duty of St. Michael’s clergy to do this. A somewhat grudging agreement it would seem. From 1888 an annual collection was taken at St. Mary’s for the upkeep of the churchyard. Both these developments probably reflect a grievance extending over several decades that St. Michael’s clergy were providing unpaid services to St. Mary’s parish. The out of Lichfield category includes baptisms for families from the towns and villages surrounding the city, but also significant number from further afield – in particular from Birmingham and London – probably because of historic or family connections.

Figure 6. Baptism and burial statistics by areas of residence

Finally the registers reveal the existence of some interesting groups of people in the population for whom a more in-depth study might be appropriate – the soldiers from the Militia Barracks in the Sandford Street area; the canal workers and boatmen on the Lichfield and Hathersage Canal and the wharfs in the St. John’s area; a huge community of coachmakers, coachmen, horsemen etc. connected with the coach routes through the city, and, in the second half of the century the railway workers on the London North Western Railway through Trent Valley and the South Staffordshire Railway through Lichfield City. 

Analysis of Christian names

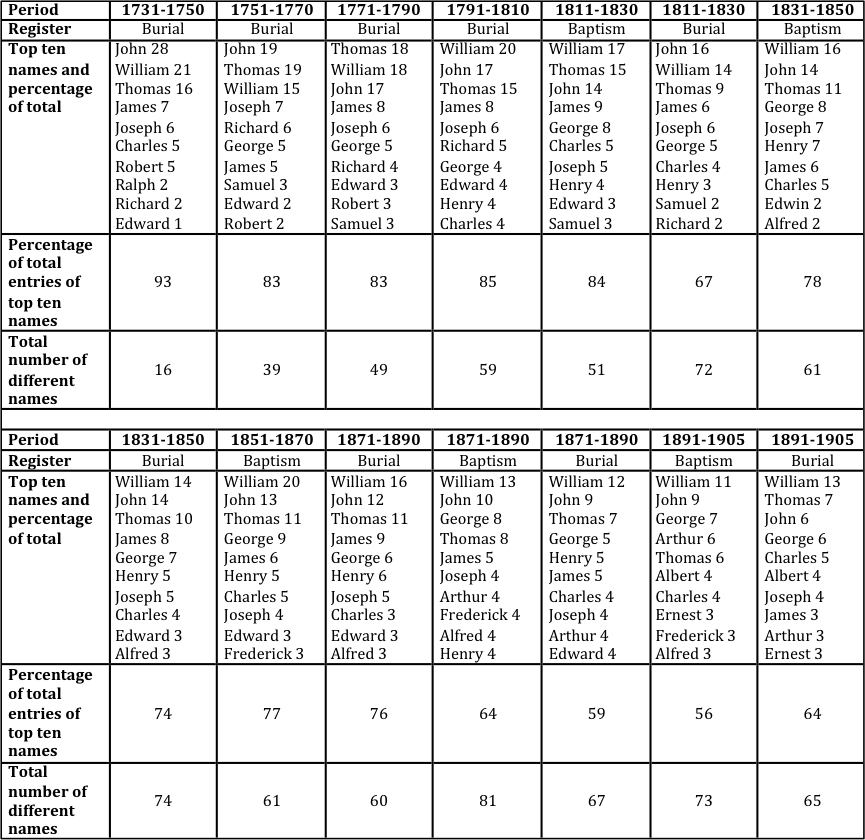
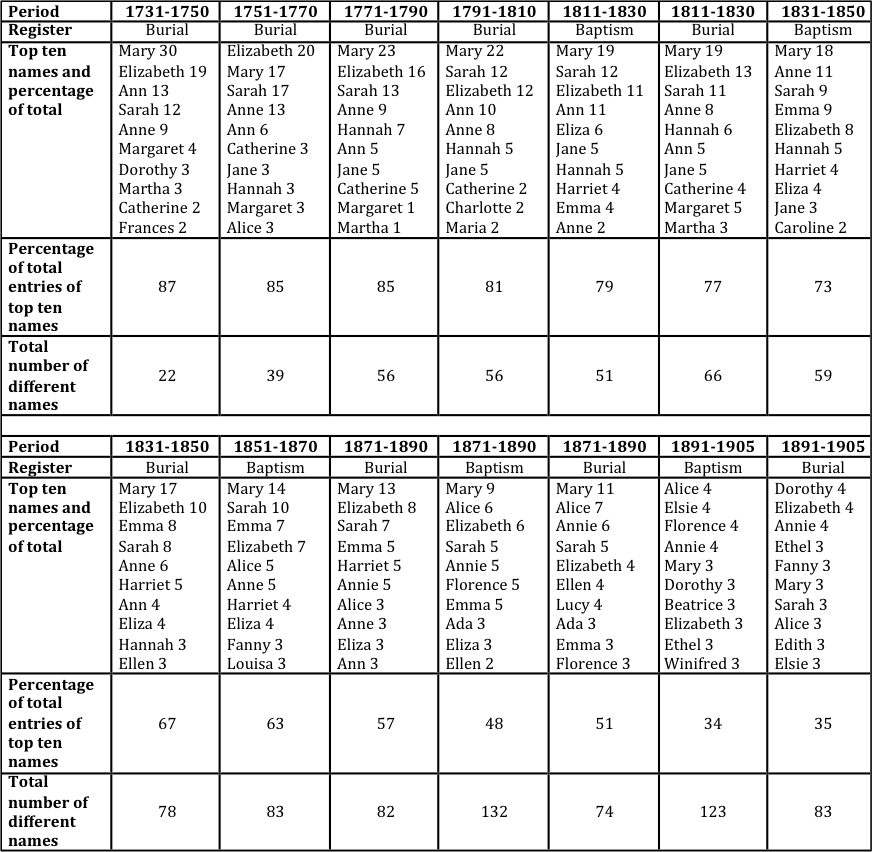
Both the baptismal and burial registers can be used to study how the Christian names of those in the parish varied over time. Whilst this might seem a somewhat trivial analysis, it does reveal something of changing attitudes and perceptions over time. From the baptismal registers, the information is directly available on a year-by-year basis. Extracting dated information from the burial registers is a little more tricky and requires the birth year to be calculated from the death year and the age at death. Even if the names are all related to the birth year, one might expect some differences – the baptismal registers will, in general, refer to those who were born in the Lichfield area, the burial registers will contain entries relating to those who were born elsewhere. Similarly the latter are more likely to indicate the preferred name of the deceased – be it first name, middle name or by-name. These points being made, details of the names over a period of around 180 years are given in table 1 for men and table 2 for women. Each table shows the following information, for the usual nominal twenty-year periods.

  • The most popular ten names in that period and the percentage of the total number of register entries for each of these.
  • The percentage of the total number of register entries that are accounted for by these top ten names. 
  • The number of different names used in the period.

For both male and female names the following broad conclusions can be drawn.

  • The most popular names remain pretty much the same over most of the period studied.
  • For the earlier periods in the 18th century the top 10 names account for 80 to 90 % of all names. This figure falls throughout the 19thcentury to around 60% for male names and 35% for female names.
  • Over the same period the number of different names increases by a factor of four.
  • Female names were always more variable than male names. 

The most popular male names (William, John and Thomas) each account for about 20% of all entries in the early periods, falling to around 6 to 12% in the late 19thcentury. Similarly the most popular female names (Elizabeth, Mary and Sarah) account for around 15 to 20% of all entries in the earlier periods, falling to around just 3% in the late 19thcentury. 

Two points arise from this study. The first is that the increasing number of names in use possibly reflects the movement from a very conservative society (at least in terms of names) to one with a wider outlook. Indeed, some of the minor names not shown in the table are quite outlandish and unconventional, particularly for the female names – for example Rosetta, Vanda and Pretoria. Secondly, in their conservatism the most popular names are very similar to those outlined in two other studies that I have carried out for the western region of the Black Country – for the parish of Kingswinfordin 1822 and 1840, and for the members of the Shut End Chapel in Pensnett from 1840 to 1890. The general population for these two studies was again composed of unskilled and skilled manual workers, and were thus similar o the population make up of St. Michael’s parish in the 19thcentury.

Table 1. Analysis of male Christian names

Table 2. Analysis of female Christian names

Ministers and Church

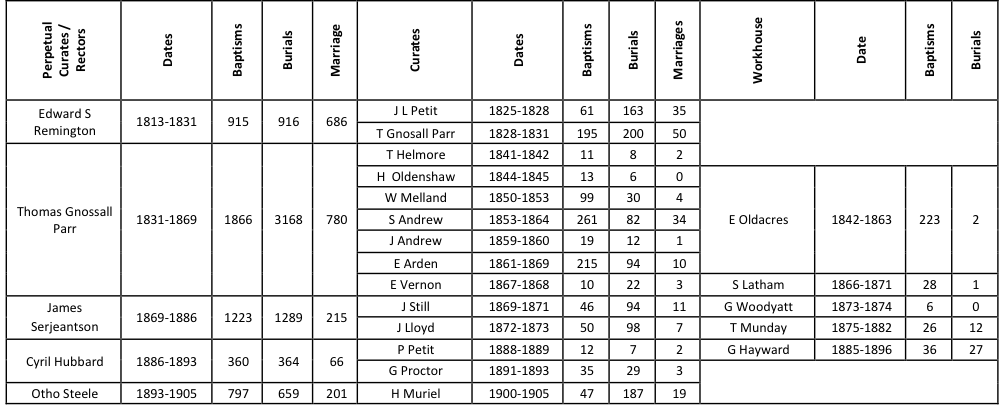
Table 3 below shows the Perpetual Curates (Rectors from 1868) at St. Michael’s, their curates or assistants, and the chaplains of the Workhouse in the period we are considering, together with the absolute numbers of baptisms, marriages and funerals they carried out. The longevity of the ministers in charge is notable, with only three perpetual curates / rectors from 1813 to 1886.  The first of these, Edward Remington, was actually the brother of an earlier Perpetual Curate at St Michael’s and the son of another, the dynasty extending back to 1757. His early career included Perpetual Curacies at St Chad’s Lichfield and Pipe Ridware, before coming to St Michael’s in 1805. In 1820, he was, in addition to St. Michael’s, instituted as Curate at Burntwood, when Burntwood itself achieved parochial status. As Perpetual Curate of St. Michael’s he would already have had oversight of Burntwood, but it seems he was formally designated its first incumbent, at least for a short period until 1828. From 1829 to 1831 he was also Vicar at Wirksworth in Derbyshire. How he managed these two rather far-flung parishes is not clear, but doubtless he utilized the services of his curates. 

One of these curates was Thomas Gnossall Parr, who held that post at St. Michael’s from 1828 to Remington’s death in 1831. He was then appointed Perpetual Curate, a post he held for 37 years before becoming the first Rector in 1868, one year before his death. He was born in 1800, the son of another Thomas Gnossall Parr, a Lichfield solicitor, and remained umarried.  In 1861 he was living at the Parsonage House on Mount Pleasant with his sister Anne, and a single servant. The number of baptisms, marriages and funerals conducted by Remington and Gnossall Parr was eye-watering – the largest number in the table being the 3168 funerals conducted by the latter. Whist they were assisted by a string of curates, they still seems to have carried most of the load themselves. 

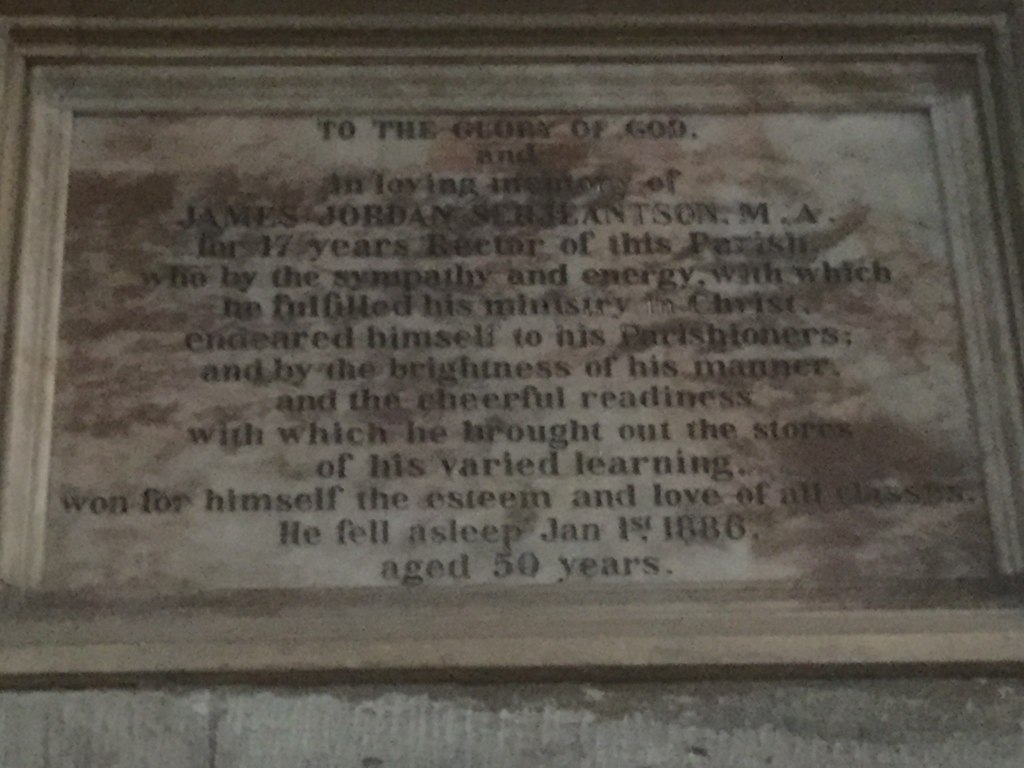
The first clergyman to be appointed Rector, James Sergeantson, was from Liverpool and educated at Trinity College in Cambridge. He was a rowing blue and part of the crew that lost the boat race in 1857 by 11 lengths. There have only been six larger losing margins in the 190 year history of the race, so I doubt it was an experience he relished. He served a curacy at Stoke before coming to St Michael’s. He was married to Elizabeth, a clergyman’s daughter and they had at least 5 children. In 1881 they lived at the Rectory, with a housekeeper, cook and two servants. He is recorded on a memorial in the church as being part of the team that rang a complete peal of Gransire Minor in 1876. He died in 1886. A memorial plaque in the chancel at St. Michael’s reads

To the glory of God and in loving memory of James Jordan Sergeantson M.A. for 17 years rector of this parish….. He fell asleep January 1st1886 aged 50 years. 

The Serjeantson Memorial

Sergeantson was followed by Cyril Hubberd, an old Etonian who graduated from St. John’s College Cambridge, and served in parishes in the south of England before coming to St. Michael’s. In 1891 he lived at the Rectory with his wife Agnes, their two children, a cook, a nursemaid and two housemaids. In 1886 he secured an arrangement, albeit somewhat grudging, with the Vicar of Mary’s who agreed to conduct the St. Mary’s funerals, although more often than not, this resulted in the St. Mary’s curates carrying out the duty on his behalf. When Hubbard left St Michael’s in 1893, he moved to the south of England and out of parish ministry. Perhaps St. Michael’s was too much for him. He is however recorded as a Chaplain in various European cities in the 1900s.

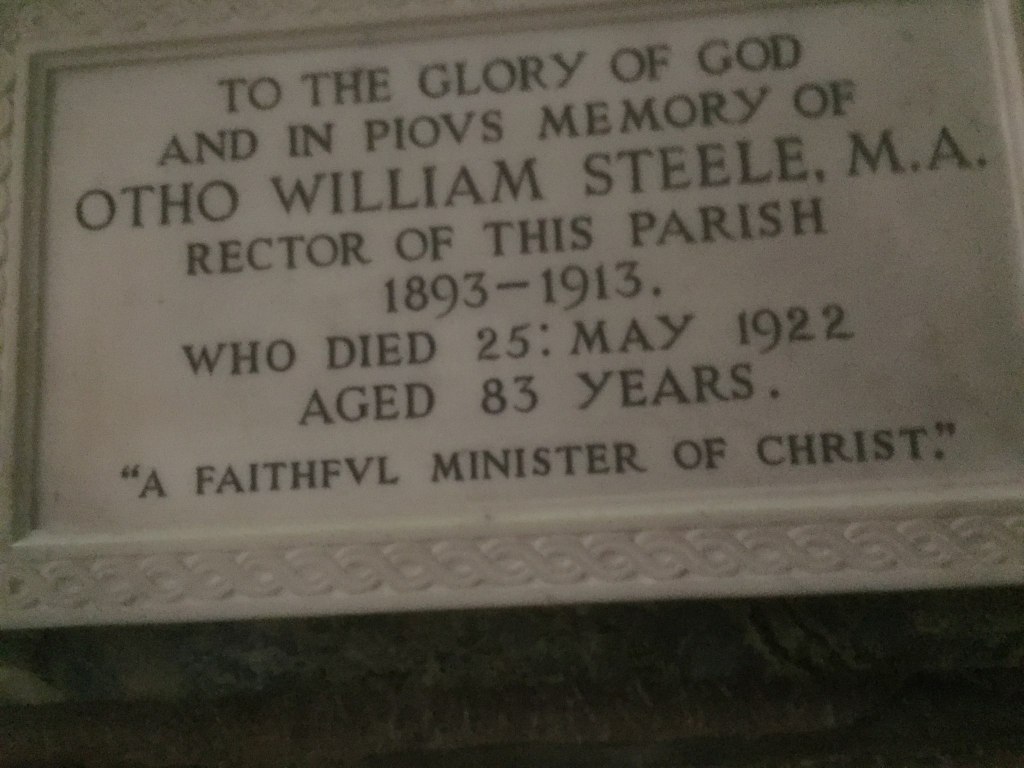
The last of the 19thcentury rectors was Otho Steele. He was born in the 1839, educated at Trinity College Dublin, and served in parishes in the east of England, Guernsey and Stoke before coming to St Michael’s in 1893. He remained there till 1913, and died in 1922. Again there is a memorial plaque in the chancel that reads as follows. 

To the glory of God and in pious memory of Otho William Steel, M.A. Rector of this parish from 1893 to 1913 who dies 25thMay 1922 aged 83 years. 

The Steele Memorial

The situation with regard to the Workhouse was interesting. The chaplains of the Workhouse conducted baptisms there, but these were recorded in the St. Michael’s register. However, up to the 1880s, all the funerals were conducted by St. Michael’s clergy. After that there seems to have been some overlap at that time with some of the curates at St. Michaels also acting as Workhouse Chaplains. 

Closing comments

The registers also indicate that a not-insignificant number of services were conducted by either visiting clergy (presumably at the family request) or by other clergy in the locality, to cover absence and holidays no doubt. The funerals of the residents at St. John’s hospital were usually conducted by the Master of the Hospital. In the early part of the century, the burials were actually in the grounds of St. John’s, with the burials registered in the St. Michael’s register, but later internments were in St. Michael’s graveyard. 

Table 3. Rectors, curates and chaplains

This post has presented what at first sight is a rather detailed technical examination of manuscripts. However it does reveal some quite fascinating details of the development of St. Michael’s parish over the 19thcentury. It was basically the parish of the lower and middle classes of the area, with very few of those at the top of Lichfield society. We see clearly a significant decrease in childhood mortality in this group over that period, and the huge risk of childbirth to women is all too clearly seen. The rise of basic literacy can also be seen from the signatures in the marriage registers. The development of the different areas of the parish can be traced in terms of a growing population and a widening of residential areas, with the increasing numbers of those within the Workhouse a reminder that such growth does not benefit all level of society. The analysis of Christian names sees an essentially conservative use of a small sub-set of names develop into a much wider use of a wide range of names, perhaps reflecting the growing horizons of the population. In ecclesiastical terms, the effect of the outlying townships becoming parishes in their own right is apparent, and the interactions between the city centre parishes is very clear – as are the reasons for the disagreement over funerals and burials between St. Michael’s and St. Mary’s.

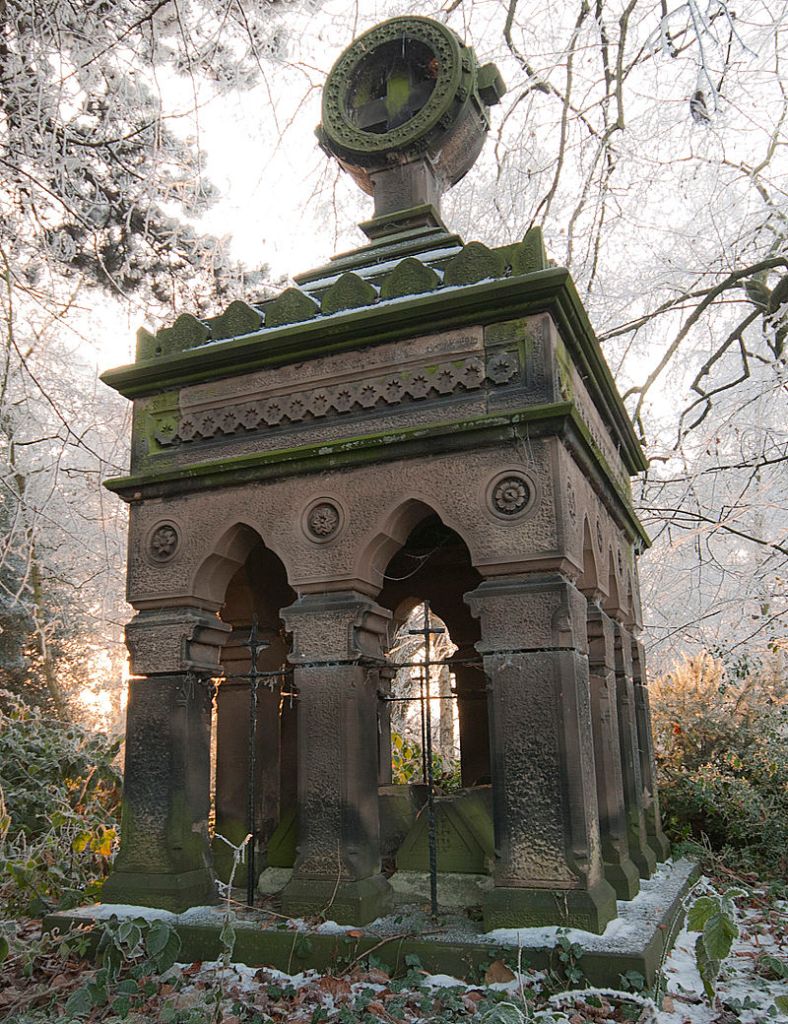
But there is much more that could be said of course about some of the many individuals who feature in the registers – for example Rev John Louis Petit, the curate from 1825 to 1828 and a noted landscape painter, James Law, the Chancellor of the diocese, whose Mausoleum still dominates the front of the churchyard (see below), John Brown, who sounded the trumpet at the charge of the Light Brigade, and many others from long term Lichfield families.

There is of course further work that could be done of this type. Perhaps the most obvious extension would be to do the same sort of analysis for the registers of St. Mary’s and St. Chad’s as the three churches obviously have significant interaction.  This would be quite possible as for the period covered in this blog the registers are again available in .rtf format that can be manipulated in spreadsheets. Maybe one day in the near future I will summon up the energy to do this. 

The second extension, that would require more work, would be the integration of the current work with other datasets – and in particular the census returns and the St Michael’s Monumental Inscriptions. Whilst the data is available, the actual task of correlation and assessment would be very significant. Maybe in a year or so. 

Finally the work could be extended to look at earlier time periods – but here the registers are not in the same convenient format, and to make them so, at least from the publically available databases would be a huge task. Maybe in another life.

St. Michael’s, Lichfield in the 19th century. Part 1

Preamble

The most common modern use for parish registers for baptism, marriage and burial is in family history research – to trace the lives of individuals and families through the centuries. But they also form a rich historical resource that can be looked at in quite another way. Where detailed registers exist, they allow a picture to be built up of the wider societal context, by looking at the entries in the register as a whole rather than individually, and considering details of birth and death statistics over time; the professions and trades of those bringing children to baptism and their places of residence.

In this post we take such a wide look at the parish registers for St, Michael’s parish in Lichfield during the 19thcentury.  These have been conveniently produced by Midland Ancestors as .rtf files, and can thus, with some manipulation, be imported in EXCEL and interrogated in a number of different ways. We begin by briefly describing the registers and the nature of St. Michael’s parish in the 19thcentury, then move on to consider statistics of baptisms and burials. The registers also give details of where the individuals lived and their trades or professions, and thus give us a snapshot of Lichfield society in the period. The marriage registers allow the level of literacy to be determined, from an analysis of those who signed the registers, and those who simply made their mark.  The registers also allow a survey of names to be carried out, which shows how the popularity of different Christian names varied over the century. Finally the registers cast some light on the ministers who performed the services, and on the nature of church practice. 

The information presented here will mainly be in the form of simple graphs and tables. Not everyone will be comfortable with such a presentation, but the material to some extent demands it. I will however attempt to describe the information shown on these figures in a more qualitative way, and try to draw out what they can tell us about church and parish in the 19thcentury. 

St Michael’s parish and the registers

Figure 1. The red solid line indicates the boundary of St. Michael’s parish around 1820. The red dotted line indicates the extra-parochial portion of Freeford township. St Michael’s church is indicated by the red cross. The green, blue and purple lines and crosses indicate the boundaries of St Chad’s parish, St Mary’s parish and the Cathedral Close and their churches respectively. The extra parochial area of the Friary is not shown.

The formation of parishes came relatively late in the Lichfield area, where the ecclesiastical organization was, until the seventeenth century, largely based on the Cathedral Prebendial system, with the Prebends appointing vicars who took responsibility for the three city centre churches. It was eventually divided into three parishes – St. Mary’s covering the city centre, St. Chad’s to the north-west and St. Michaels to the south west, south east and south (figure 1). There were three extra-parochial areas – the Cathedral Close, the area around the old Friary and part of the township of Freeford. Of the three parishes, St. Michael’s is the largest. The church itself and its large graveyard on Greenhill is just to the east of the boundary with St. Mary’s parish. In the early part of the 19th century, the parish contained the land immediately to the east and south of the city centre, and large areas further to the south and east containing a number of smaller townships – Wall to the south, Burntwood in the south west, Streethay in the north east, and Freeford and Fulfen to the east. In addition there were a number of detached portions – at Fisherwick and Haselour to the east for example. Thus, whilst the registers mainly concentrate on those who live close to the church in the more densely populated area on the eastern edge of the city, they also contain entries for a more dispersed rural population. As the 19thcentury progressed, some of the outlying townships became parishes in their own right – Burntwood in 1820 and Wall in 1845 and after those dates their inhabitants largely disappear from the St. Michael’s registers. Similarly a large area to the west of the city around the hamlet of Leamonsley formed Christchurch parish in1848. 

There are however further complications. St. Mary’s parish that encompasses the city centre has no graveyard, and used that at Greenhill. Thus the St. Michael’s burial register also contains many entries from St. Mary’ parish.  There also seems to have been a leakage across parish boundaries in baptism and marriage, with parishioners of St. Mary’s and St. Chad’s using St. Michael’s– and no doubt vice versa. The other complicating factor was the existence of the Lichfield Union Workhouse in St. Michael’s parish from 1840 onwards, which housed paupers from a wide area around Lichfield. As these were mainly men, care needs to be taken in any analysis, as the Workhouse entries in the registers can skew the statistics significantly if they are not allowed properly for. 

Before considering the detailed statistics from the registers, it is instructive to look at the general social make up of the parish in the 19thcentury. The baptismal registers contain brief descriptions of the occupation of the one who brings the child for baptism, usually the father. A statistical analysis of this information is, to say the least, difficult, so I will confine myself to only broad comments here. In total there are 6885 baptisms recorded. The number of families represented will be significantly less than this of course. But for these baptisms 2100 give an occupation as “Labourer” and around 650 are economically inactive (most often “Single Women” in the Workhouse or “Spinsters”). Thus around 2750 are at the lowest levels of the society of 19thcentury Lichfield. At the other end of the scale, there are around 35 baptisms of children of those who might be described as “Professional” – bankers, solicitors, architects etc.; 29 from the Ecclesiastical Establishment; and 40 who describe themselves as “Gentlemen”. In between there is a wide range of trades and occupations present of differing levels of skill, from low skilled gardeners and bricklayers to the highly skilled clockmakers, cordwainers and coach builders. Basically it seems that St Michael’s in the 19th century was a church for the workers and middle class artisans and tradesmen of the city – and certainly it attracted few at the higher end of the social scale to bring their children for baptism.  This is in accord with the various monuments and inscriptions within the church, few of which date from the 19th century, with most from the 18th and 20th centuries, indicating that for this period the upper reaches of Lichfield society looked elsewhere.

Population Statistics

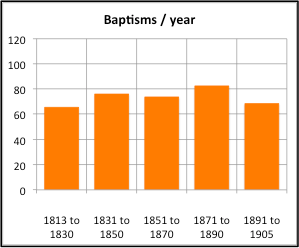
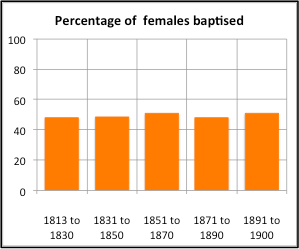
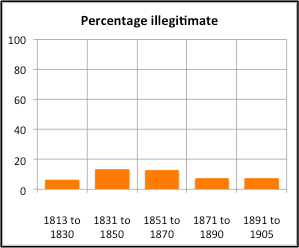
Figure 2 shows the basic statistics from the baptismal register for the period between 1813 and 1905. Here the data is shown in nominally 20 year bands, with the first (1813-1830) and the last (1891-1905) being somewhat shorter. This variability in period can be allowed for to some extent by considering the number of baptisms / year in each band.  It can be seen that there were around 70 baptisms a year across the period, with that figure remaining relatively stable. The expected rise in baptism numbers due to population growth thus seems to have been balanced by the number of baptisms taking place in the new chapels at Burntwood, Wall and Christchurch, and also no doubt by an increase in the number of baptisms in non-conformist churches. The percentage of females was baptized was close to 50% throughout the period as would be expected, which at least shows the inhabitants of the parish in the 19thcentury did not practice female infanticide. Finally it can be seen that that the number of illegitimate children baptised is around 5 to 10% of the whole. This graph may not be wholly accurate however, as illegitimacy was recorded in different ways over the century, or not recorded at all, so some cases may have been missed, but any errors will be small.

Figure 2. Baptism statistics for number of baptisms / year, percentage of baptised females and the percentage of illegitimate children

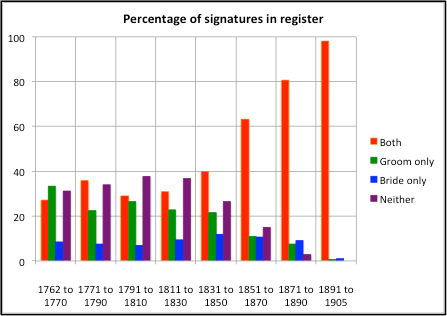
Figures 3 show the marriage statistics . This data is given over a longer period than for the baptismal reisters, as the .rtf transcription extends back further into the 18thcentury. The number of marriages per year peaks at something over 40 marriages per year between 1811 and 1830. The register also provides an indication of the level of literacy amongst those getting married. The right hand figure gives the proportion of weddings where bride and groom both signed the register, just one of them signed, or neither signed. Very broadly, up to the middle of the nineteenth century, there were around a third of marriages where neither couple could sign their name, a third of marriages where one of them could (most often the groom) and around a third where both signed. After that time, the proportion of weddings where both signed increased rapidly, no doubt due to the establishment of the National Schools in the area, and by the start of the 20th century both partners almost always signed.

Figure 3. Marriage statistics, showing number of marriages per year and the percentage of participants signing the register.

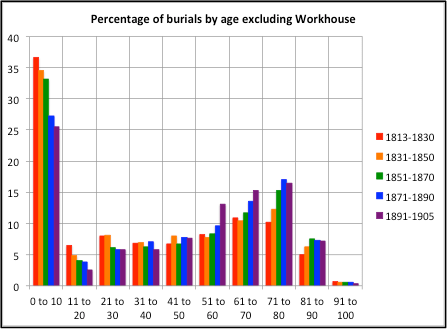
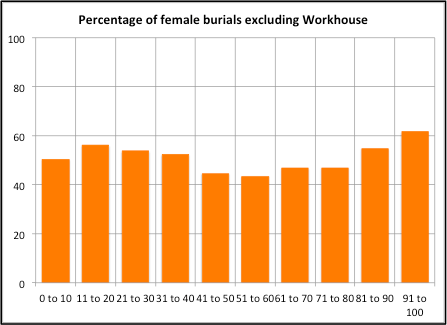
Figure 4 shows the analysis of the burial statistics, excluding the Workhouse entries. The number of burials / year increases through the century, reflecting the increase in population. In the breakdown of burials by age group, the large infant mortality rate is clear, although burials in the 0 to 10 age group decrease from 36% of all burials to 25% over the 19th century. This same trend of reducing mortality is shown in the 11 to 20 and 21 to 30 age groups. The number of burials then increases with age, with a peak in the 71 to 80 age range, with a sharp fall off for the oldest age ranges. The percentage of female burials against age range rises from around 50% for the lowest age range, then increases to around 55% for the 11 to 20 and 21 to 30 age ranges, reflecting deaths during childbirth. There is a trough at just over 40% in the 51 to 60 age range as male mortality peaks, with a rise to around 60% in the highest age ranges, which simply reflects the greater longevity of women if they survive infancy and childbirth.

Figure 4. Burial statistics, excluding Workhouse data, showing number burials / year, burials by age range and percentage of female burials

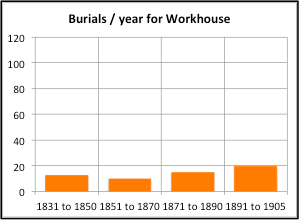
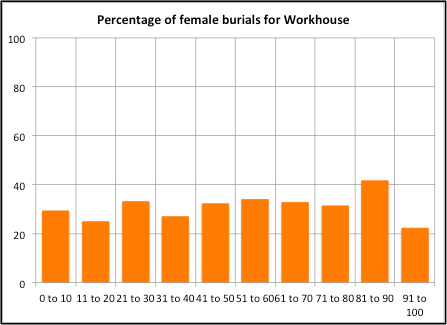
Figure 5 shows similar figures for Workhouse burials. It can be seen that the number of burials per year is between 10 and 20 – a significant proportion of the whole. The burials by age show the same form as for the general population, although the child mortality rate remains at around 35% throughout the century rather than falling. The percentage of female burials by age do not show the same trend as for the general population, although this might possibly be because the sample size is smaller and any trend masked by statistical variation. 

Figure 5. Burial statistics, for Workhouse data, showing number burials / year, burials by age range and percentage of female burials

Part 2 of this blog post can be found here.

Measuring the behaviour of pedestrians in high winds

This post outlines some of the results from the project “The safety of pedestrians, cyclists and motor vehicles in highly turbulent urban wind flows” funded by the UK Engineering and Physical Sciences Research Council. The work that is described below involved a number of colleagues, whose contribution to the project was significantly greater than mine, particularly Dr Zhenru Shu, Dr Mike Jesson, Dr Andrew Quinn, and Prof Mark Sterling. Their contribution is gratefully acknowledged.

1. Introduction

The assessment of wind conditions around new buildings has become standard practice over recent years, either by wind tunnel testing or through the use of CFD calculations. The assessments usually concentrate on two aspects – the effect of wind conditions on human comfort and thus the usability of the area around the building; and the effect of high wind conditions on human safety and stability. It is with the latter that this paper is concerned. In general the criterion for assessing a site for pedestrian safety is based on a gust wind speed of a specified magnitude with a specified probability of occurring, that is deemed to be at the safety limit. Current UK practice is illustrated in Figure 1 below. There is a great deal of variability in the specification of this windspeed and the specification is usually based on largely subjective data from questionnaires etc. Following a fatality caused by high winds around a new building in the city of Leeds, a major research project was funded by the UK Engineering and Science Research Council to enable the University of Birmingham to investigate the safety of vehicles and pedestrians around high-rise buildings. This included full-scale wind measurements and the assessment of the ability of different wind tunnel and CFD techniques to replicate these measurements. In addition tests were carried out to make quantitative measurements of human response in gusty winds, using instrumentation mounted on volunteers. As will be appreciated by any reader who has tried to make full scale wind measurements of any type, the setting up of the experimental apparatus usually guarantees that strong winds will not occur, and the same phenomenon was observed for these tests. The two winter seasons that were available for these measurements had relatively few storms, and only two trials could be carried out. As a result, although some very interesting results were obtained and will be presented in what follows, they must be regarded as provisional and tentative. More work is required to obtain a fuller dataset of human response measurements of the type that are presented here.

Figure 1 Current UK practice for specifying wind comfort and safety (Values given are for mean wind speed and percentage of time exceeded)

2. The trials

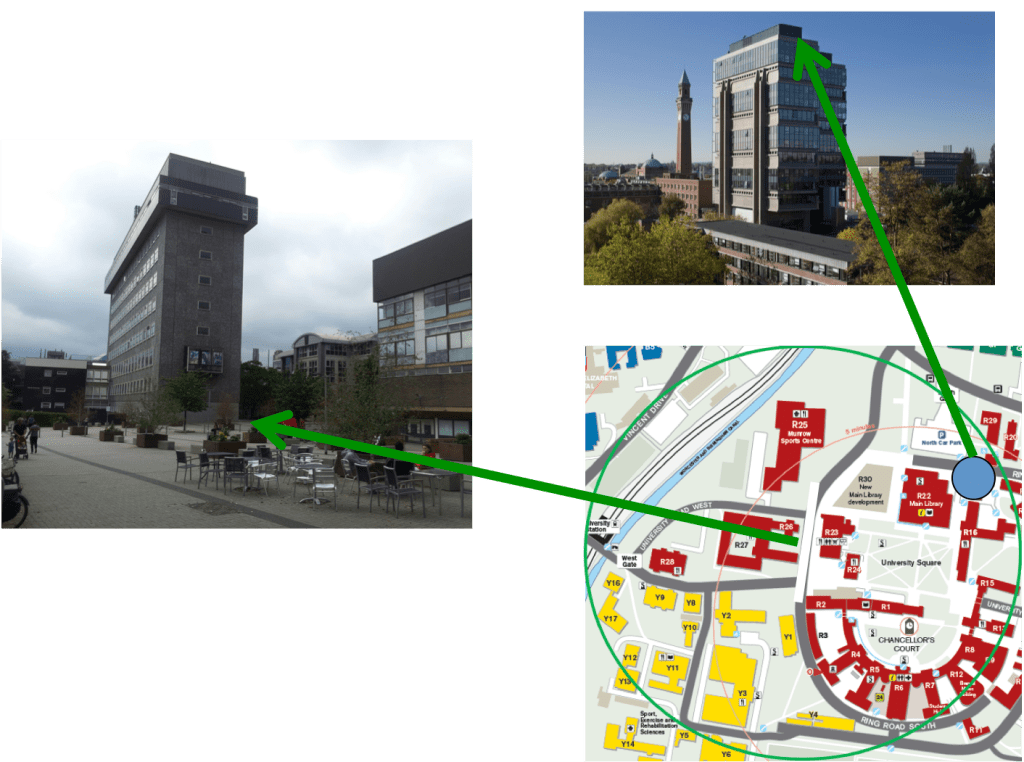
Figure 2. The test site showing the walking route along the Biosciences building and the reference anemometer site on the Moorhead Tower

The trials on the response of pedestrians to high winds were carried out on the campus of the University of Birmingham (figure 2). A walking route of length 63m was set up in the centre of the campus. Eight sonic anemometers were placed 2m above the ground at 9m intervals along the route.  A reference anemometer was installed at the top of the nearby high rise Muirhead Tower. A reference anemometer was mounted at the top of the Moorhead Tower. All the anemometers sampled at 10 samples / sec, and data was recorded on an AntiLog data logger. Human response was measured using GaitUp Physilog (combined accelerometer and gyroscope) sensors. Sensors were attached to both feet of the subjects, and provided details of walking speed and stride parameters every second through GaitUp’s proprietary software. A third sensor was placed on the back of a safety jacket worn by the subjects and thus gave details of upper body acceleration.  

Two trials were carried out – October 2017 during Storm Ophelia, and in February 2019 (figure 3. In total there were 15 subjects, with weights ranging from 54 to 110kg, and ages between 28 and 75. Each subject was asked to walk along the test route 10 times in each direction during which the gait and acceleration information was measured. 

Figure 3 Wind conditions during the trials

3. Analysis

The overall wind conditions at the reference site on the Muirhead Tower are shown in figure 3 for the two test periods. It can be seen that in each case the wind is from the South-West (shown in longer term analysis to strongly be the prevailing wind direction), with gust speeds up to 18m/s

Before the data could be analysed, some data preparation was required. Firstly the gait data and accelerometer time series had to be synchronized with the anemometer time series of velocities and the raw accelerometer data was transformed into horizontal and vertical co-ordinates. The time series of velocity and direction relative to the subjects were then derived form the stationary anemometer data as the subject walked along the route. A histogram of gust speed distribution, as experienced by the volunteers, for the two trials is shown in figure 4.

Figure 4 Histogram of gust velocities

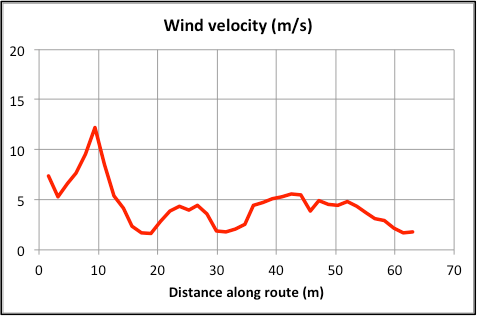
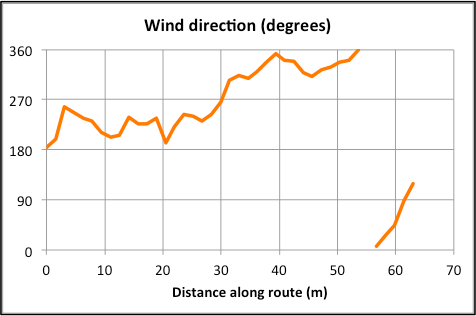
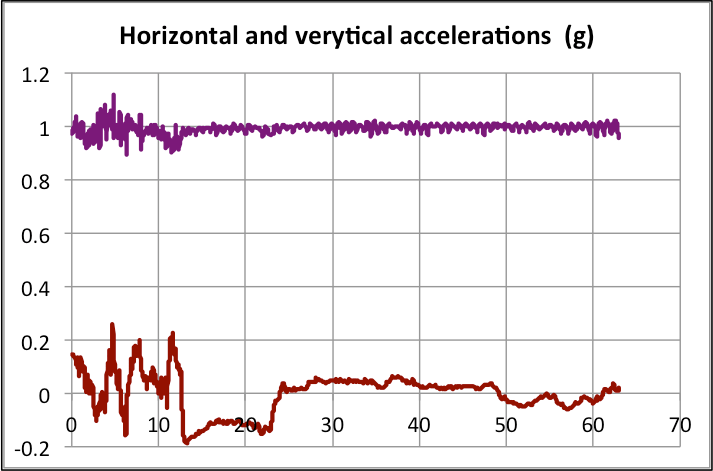
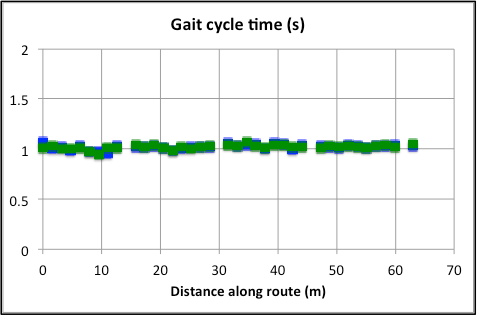
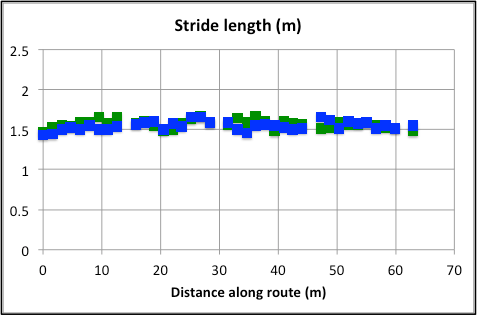
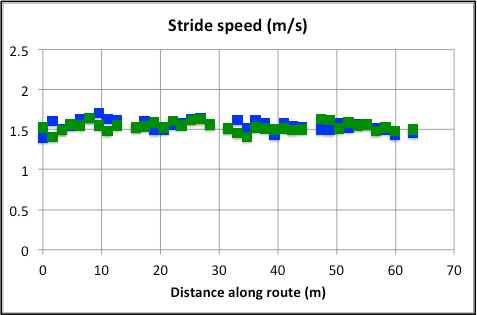
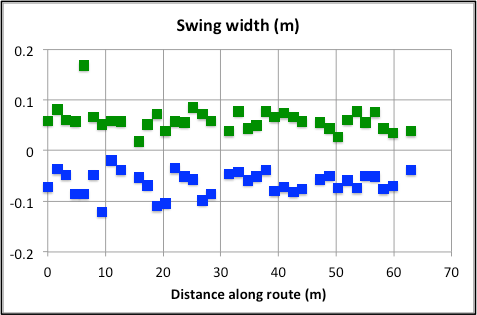
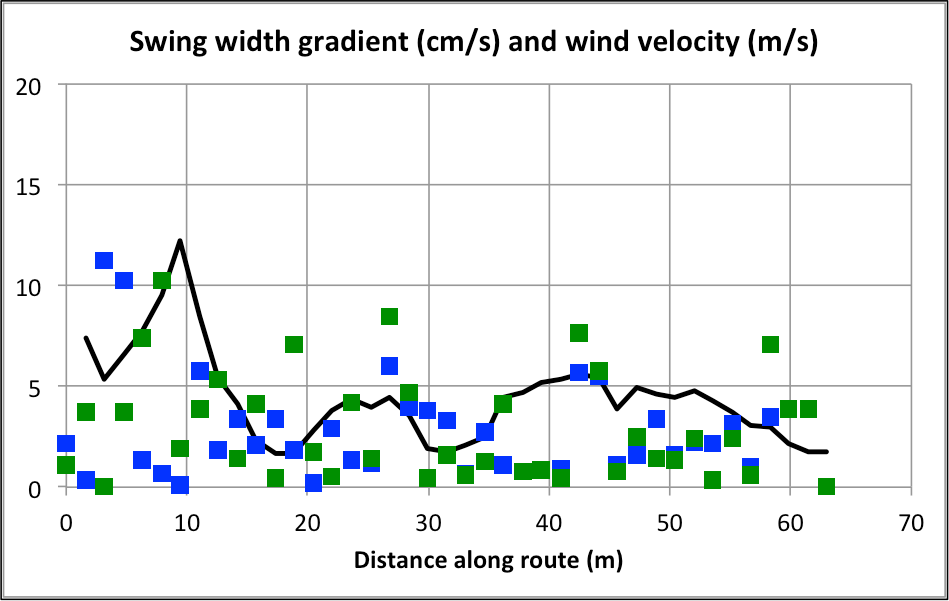
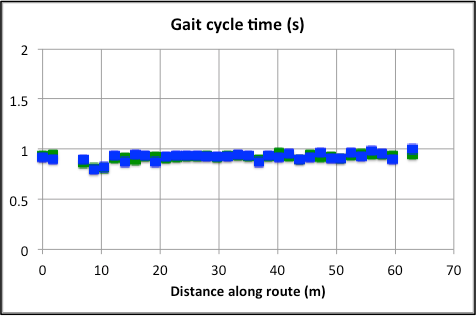
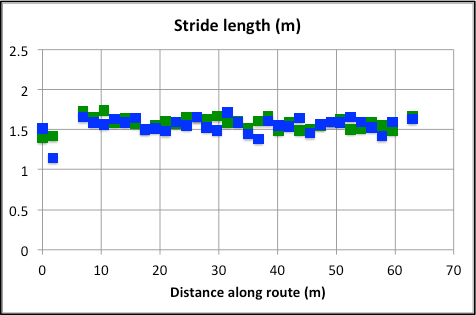
Initial inspection of the data showed that there was very significant variability between each recorded walk along the track. This was in part due to the normal variation in wind conditions with higher gust speeds on some walks than on other, but it also seemed that the reaction of subjects varied both with time and between subjects. A typical set of results is shown in figure 5.  The direction of travel of the subject is from 0 to 63m. The wind speed relative to the subject can be seen to have a maximum of around 12 m/s in this case (associated with the corner flow from an adjacent building). The horizontal and vertical accelerometer data show slight oscillations around the gust position gust with the former having an average value of zero, and the latter an average value of 1.0. Most of the gait measurements (cycle time, stride length, stride speed) revealed little change in behaviour as the subjects walked along the route, all remaining approximately constant along the walk in most conditions.  The one parameter that did show variation was the swing width – the lateral variation of the foot during a stride cycle. In particular rapid changes in swing width were sometimes (but not always) observed as the subjects encountered gusts – see the graph for swing width gradient.

Figure 5 Wind, acceleration and gait parameters for typical gust (green symbols indictate left foot, blue symbols indicate right foot)

At the highest gust speeds that were recorded, there were three events where the subject became unstable to a variable extent. Figure 6 shows the experimental data for one such case. Here it can be seen that at the gust position there are significant vertical and horizontal acceleration responses, and all the gait parameters show a response at the event. The swing width response is again the most noticeable.

Figure 6 Wind, acceleration and gait parameters for strong gust

A somewhat more quantitative approach to the data is possible by looking at the various responses statistically. In what follows we consider the results from both trials, for all subjects, as one dataset. Figure 7 shows the percentage of such gusts in which the subjects showed a swing width response (with either the left or right swing width changing by more than 0.06m in one second) and acceleration response (where an acceleration response greater than 0.05g could be detected) or an instability response (with an acceleration response greater than 0.4g). In considering these results the low number of gust events in the upper velocity bands need to be considered, as does the subjectivity of the response limits used. These points being made, it can be seen that for even low speed gusts of magnitude less than 10m/s, around 50% of the gusts result in a swing width response (which are mostly unconscious responses not registered by the subject). The frequency of such responses rise rapidly for gust speeds above 10 m/s, and all gusts over 14 m /s show such a response. Acceleration responses become significant at gust speeds of about 10m/s, and are observed for all gusts above 16m/s. Instability responses begin to occur at gust speeds over 14m/s, although it should be noted here that only a very small number of such events (3) were observed.

Figure 7 Frequency of different types of response

4. Concluding remarks

The results for human response in gusts presented here suggest that three levels of response can be identified – swing width response , upper body acceleration response and instability response, with the frequency of each such response increasing with wind speed. However it must be emphasised once more that the number of bot high speed gust events and the number of subjects was too small for a valid statistical analysis to be carried out, and more data is required before firmer conclusions can be drawn.

Train crosswind performance – is there a “best” shape?

ICE 3 Velaro

This post arises out of a discussion with a number of colleagues on the issue of train overturning, in particular Mr Terry Johnson and Dr Dave Soper. Their (perhaps inadvertent) contribution to the development of the ideas set out below is gratefully acknowledged, although the responsibility for any inadequacies and errors must remain mine.

1. Introduction

In recent decades a great deal of research has been carried out to investigate the safety of trains in high cross winds, primarily to determine the wind speeds at which overturning will occur, and the risk of a wind induced accident (Baker et al, 2019). This usually takes the form of the determination of the aerodynamic forces and moment coefficient for a particular train, the use of these coefficients to determine the cross wind characteristic (CWC) – effectively a plot of accident wind speed against vehicle speed – and then some sort of risk analysis on the route over which the train will run. The first two steps are usually the concern of train manufacturers and are undertaken when the design of the train, at least in terms of overall shape and size, is fairly well advanced. The third step is usually the concern of the infrastructure operator. One question that is not often asked however is whether there is a “best” design for a train to minimise the risk of a wind induced accident, and thus to maximise safety. This has been addressed to some extent by a number of recent investigations that used a combination of CFD methods to calculate the forces and moments on a train, and optimisation methods to consider the effect of changes to train geometry. It is not however clear as to what should be the objective function of such optimisation – for example a number of different force or moment coefficients for a range of different yaw angles could be chosen. This post addresses this issue though an analysis of accident risk and investigates the aerodynamic parameters required to minimise this risk 

2. Aerodynamic force and moment coefficients

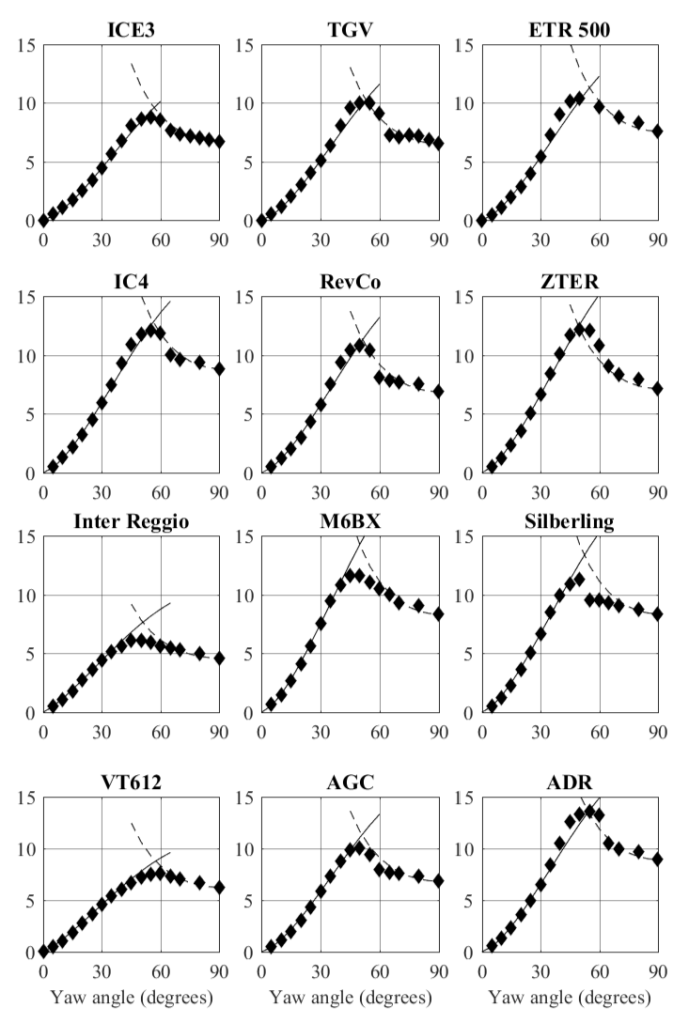
In a recent book (Baker et al, 2019) the author suggests a way of parameterising train aerodynamic force and moment data that seems to have a wide validity. This is set out in Box 1 below, in which the formulation for lee rail rolling moment coefficient is given, and is illustrated for a specific case. It applies equally well to side and lift force coefficient data. It can be seen that the form of the rolling moment / yaw angle curve is specified by four parameters – the coefficients at yaw angles of 30 and 90 degrees and exponent shape factors that describe the shape of curve, n1 and n2. Figure 1 shows a comparison of this methodology with side force coefficient data from the CEN codes (CEN, 2018) and the AeroTRAIN project (Paradot et al, 2015) as given in Baker et al (2019). All this data was obtained in a consistent way, with an STBR ground simulation in low turbulence wind tunnels. The agreement can be seen to be in general good and gives some confidence in the use of the parameterisation in what follows. The biggest discrepancy is in the transition region between the high and low yaw angle regimes, but it will be seen that this is not particularly critical to the argument that follows.

Box 1. Force and moment coefficient parameterisation
Figure 1 Parametrisation curve fit (from Baker et al, 2019)

3. Crosswind characteristics

The method used to specify the crosswind characteristic is also taken from Baker et al (2019) and is set out in Box 2. Using this methodology, the CWC are functions of n1 and n2, the ratio of the moment coefficients at yaw angles of 90 and 30 degrees, and what is defined as a characteristic wind speed, which is itself a function of train and track parameters. Box 2 gives the formulation for flat straight track, with a wind angle normal to the track – a fuller form can be found in Baker et al (2019). A comparison of this method with the results from CEN (2018) and Paradot et al (2015) is given in figure 2, again from Baker et al (2019). Agreement can be seen to be good, and this gives further confidence in the use of the methodology in what follows. 

Box 2 Calculation of cross wind characteristics
Figure 2 Cross wind characteristic curve fit (from Baker eta al, 2019)

Box 2 also indicates how the accident risk can be calculated for a specific reference site using the Weibull distribution to specify wind speed probabilities. We assume a section of railway of a specified length, with specified values of the Weibull parameters and a typical service pattern, and we then express the CWCs as a plot of train speed against the probability that a wind induced accident will occur in the section, rather than accident wind speed. This enables us to better address the question as to what is a “good” vehicle in cross wind terms, as it will highlight the relative importance in risk terms of different vehicle speed ranges. 

4. Analysis

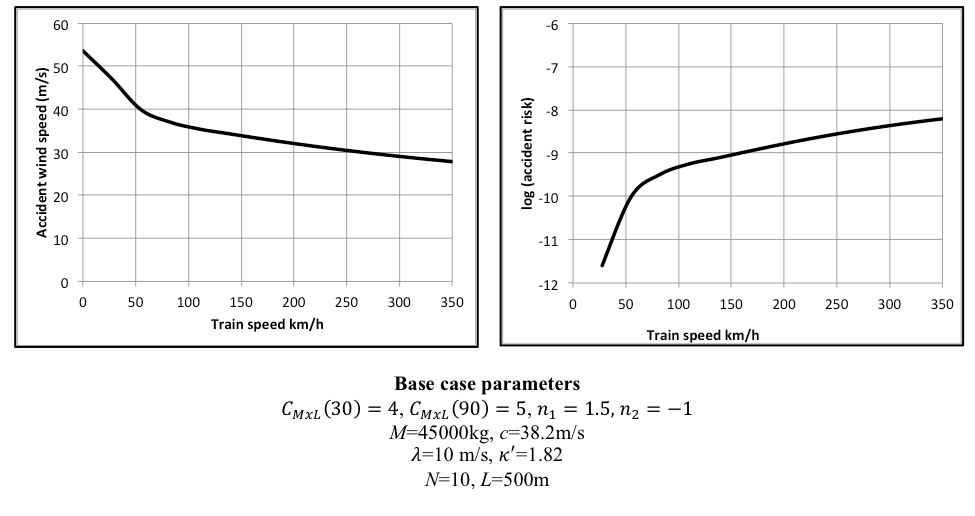
Figure 3 shows the calculated CWC, expressed as both an accident wind speed plot and as a risk plot, for what we will take as our base case. The parameters for this case are shown in the figure. The plot of accident wind speed against vehicle speed shows a reduction in the former as the latter increases, as would be expected. There is a break in gradient, at the point of transition between the low yaw angle (at high speed) and high yaw angle (at low speed) formulations of Box 2. Figure 2 shows that this is quite typical of the calculated CWCs from Paradot et al (2015). The plot of site risk against vehicle speed shows an increase in risk with the vehicle speed. At the vehicle speed of 350 km/hr the logarithmic risk is around -8 (but remember that this absolute value is completely arbitrary). The risk falls by an order of magnitude as the speed decreases through the low yaw angle range to around 100 km/h, with an increased rate of fall for low speeds, where the high yaw angle formulation becomes relevant.

Figure 3 CWC for base case

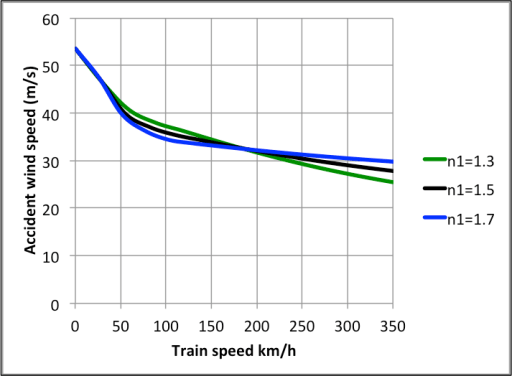
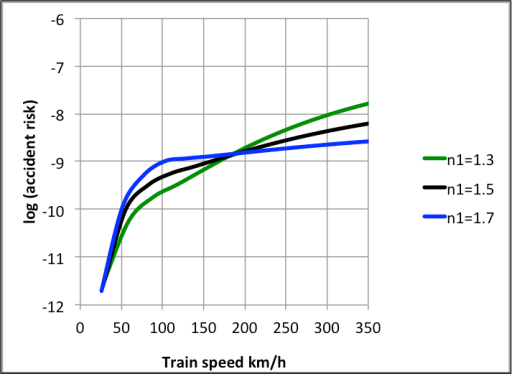
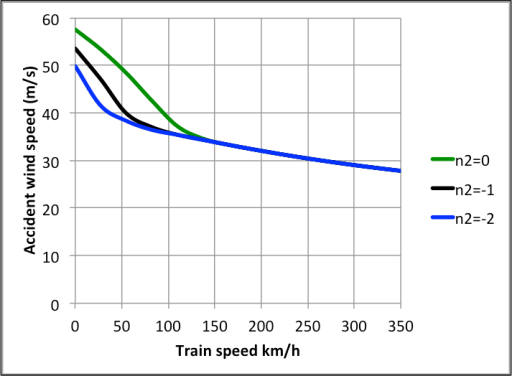
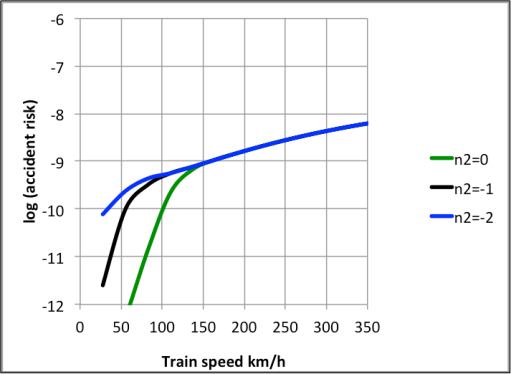
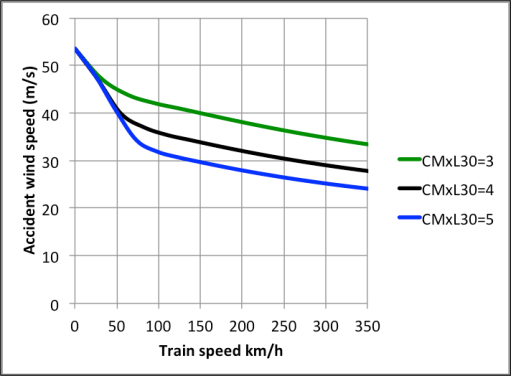
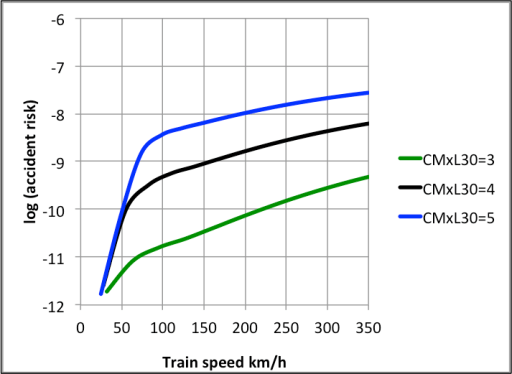
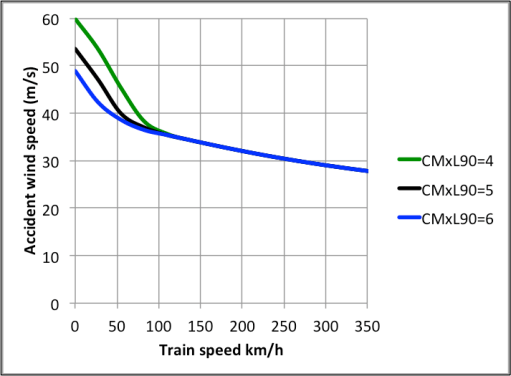
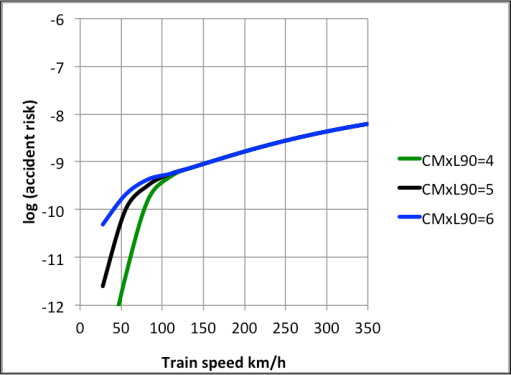
Figures 4 to 7 show the effect on the CWCs of changing the parameters for the moment characteristics. As the low yaw angle exponent n1 is varied between 1.3 and 1.7, there are variations of about half a magnitude in risk for the higher train velocities, although this varies through the speed range. This parameter is typically around 0.9 to 1.1 for lorries, 1.2 to 1.4 for blunt nosed trains, 1.4 to 1.6 for streamlined trains, and 1.7 to 2.0 for trailing vehicles. As the high yaw angle exponent n2 is varied, the variations in accident velocity and risk are confined to the low speed range as would be expected, although here the variations in risk can be several orders of magnitude. As the lee rail rolling moment coefficient at 30 degrees is varied between 3 and 5, there can be seen to be very significant variations in both accident wind speeds and risk throughout the speed range. For variations in the lee rail rolling moment coefficient at 90 degrees only the low speed accident wind speeds and risk levels are affected as would be expected. From these graphs it can be concluded that the risk of an overturning accident will be reduced for high vehicle speeds if n1 increases and the lee rail rolling moment coefficient at 30 degrees decreases; and for low vehicle speeds if n2 increases (becomes less negative) and the lee rail rolling moment at 90 degrees decreases. Of the parameters the 30 degree coefficient produces most change in accident wind speeds and risk levels across the speed range, and is perhaps where most design effort should be concentrated.

Now let us consider specific trains. Table 1 shows, for the CEN (2018) and AeroTRAIN (Paradot et al, 2015) trains, the maximum train speed, the values of the four parameters that define the rolling moment characteristic, the characteristic velocity, and the risk at the maximum operating speed. Those shaded red indicate values that would increase risk significantly above the average, and those shown in green indicate values that would decrease risk significantly the average. It can be seen that of these trains the ICE3, IR and Silbering has the “best” values of rolling moment coefficient. For the ICE3 this is presumably due to the nose shape, resulting in low levels of lift and side force, and thus rolling moment. For the IR and Silberling however, these low values are due to the lack of underbody blockage, at least as modelled in the wind tunnel tests. The ICE3 values of n1 and n2 are around the average, whilst those for the IR and Silberling are low, and would thus tend to increase risk. The worst train in terms of rolling moment coefficients is the double deck M6BX. The IC4, RevCo and ZTER also have high values of the coefficient at 90 degrees.

Table 1 Performance of a range of trains

The risk at the maximum speed for the all trains, with one exception, is between -7.3 and -8.4 i.e. it varies by one order of magnitude. The ICE3, TGV, ZTER and IR have the lowest risk and the M6BX the highest for the standard site. This risk variation is perhaps less than would be expected, and is partly caused by the reduction in risk with the reduction in maximum operating speed. The outlier from the range of -7.3 to -8.4 is the ADR, which has a low value of -9.1, which is due to its high mass and high resulting characteristic velocity. 

Concluding remarks

From the above, it can be seen that for high speed trains, the aerodynamic parameter that most affects the overturning risk is the lee rail rolling moment coefficient in the low yaw angle range, characterised by the value at 30 degrees. In these terms the ICE3 shape is “best”. However this does not necessarily apply for lower speeds, when the higher yaw angle range becomes of importance. These points being made there are some important caveats.

  • The overturning wind speed and thus accident risk depends upon a range of parameters as well as the aerodynamic characteristics. Train mass is particularly important.
  • Similarly the infrastructure characteristics are important, and accident wind speed and risk will be affected by can’t and topography.
  • Perhaps most importantly, the level of risk is determined by the nature of the train operation itself – if speed limits are imposed in high winds, it is quite possible that the most important aerodynamic characteristics will move from those in the low yaw angle range to those in the high yaw angle range.

One further point is of interest. In Baker at al (2019) the head pressure pulse magnitudes and wake slipstream gust velocities are tabulated for orange of trains. Of those trains included, the Velaro (i.e. the ICE3) has both the lowest pressure pulse magnitude and the lowest slipstream gust velocities, suggesting that the nose / tail shape of this train has considerable aerodynamic advantages.

References

Baker, C., Johnson, T., Flynn, D., Hemida, H., Quinn, A., Soper, D., Sterling, M. (2019) Train Aerodynamics – Fundamental and Applications, Elsevier.

CEN, 2018. Railway applications — Aerodynamics — Part 6: Requirements and test procedures for cross wind assessment. EN 14067-6:2018. 

Paradot, N., Gregoire, R., Stiepel, M., Blanco, A., Sima, M. et al., 2015. Crosswind sensitivity assessment of a representative Europe-wide range of conventional vehicles. Proceedings of the Institution of Mechanical Engineers. Part F Journal of Rail and Rapid Transit 229 (6), 594-624.

A policeman’s life – Samuel Hicklin (1858-1924) Part 3

Part 1 – A (very) young constable 

Part 2 – Climbing the ladder  – from Sergeant to Superintendent

Chief Superintendent Hicklin

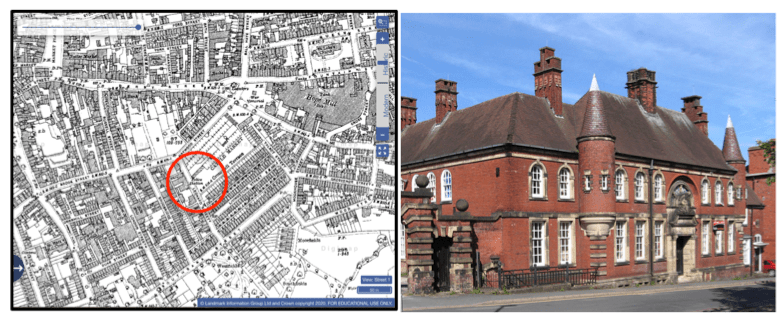
Burslem Police Station (from Edina Digimap 1920 and https://artuk.org/discover/artworks/burslem-police-station-18678)

Hicklin became Chief Superintendent in late 1906 in charge of the Potteries District (District C) with its four Divisions of Burslem, Longton, Stoke and Tunstall, and was based at Burslem Police station. He also seems to have more local responsibility for the Burslem Division with its 16 police stations, although this was no doubt delegated to some extent. As a Chief Superintendent Hicklin was even more a public figure than before and attended many civic and community functions. The Staffordshire Sentinel reported on his involvement in St John’s Ambulance exam awards, civic church services and church parades, charity football matches, formal dinners, funerals, council events and so on.

The range of crimes and offences dealt with by Hicklin and his men was similar to that at Burton, with licensing issues and traffic offences forming the majority of cases. The one that drew most public attention however was again a murder – that of Sarah Ann Price, aged 51, the wife of George Price, a colliery labourer. It would appear that the couple had been drinking heavily together, and had then quarreled. During the quarrel, Price had poured paraffin over his wife and set her on fire. She died from her burns, “burnt to a cinder”. Hicklin arrested Price and was involved in his prosecution for murder. Not surprisingly the incident created much interest in the press, both locally and nationally.

The other major challenge that presented itself was the policing of elections and, with more difficulty, strikes and industrial action. The major incident during Hicklin’s time at Burslem was a widespread strike amongst miners in early July 1909, aiming to increase the length of the lunch break and to increase pay for Saturday working. This not only involved walk outs, but also large crowds of striking miners moved around the area, aiming to force miners at non-striking pits to join them, and closing other industries. There was much violence and intimidation, and the police stood between the strikers on one hand and the non-strikers and mine owners on the other. The whole police force in the area was stretched very thinly, and Hicklin himself, whilst trying to persuade a crowd of 300 to 400 miners to disperse to enable non-striking miners to go home, was himself “assailed with a volley of stones”. The strikes were settled after a few days, with some small concessions from the employers on the length of the “snapping time” – or lunch break, but the trials for riot and affray occupied the Magistrate’s courts and Assizes for many months after. 

In 1910 Stoke on Trent City Police was formed with a merger of Hanley Borough Police and that part of the County Force area then within the Potteries Federation. This included significant parts of the then District C of the Staffordshire Constabulary, and a major re-organisation of the County force took place. A new District C was formed, spanning both parts of the Potteries and also more rural areas of the county, of which Hicklin took charge. The Divisions of this District were Leek, Newcastle, Stone and Uttoxeter.  The District covered a very wide geographical area in the north of the county. Hicklin and his family moved to the police station at Leek, where the District headquarters were located, in early 1910.

Leek police station (from Edina Digimap 1920 and https://commons.wikimedia.org/wiki/File:Leek_-_Police_Station_-_geograph.org.uk_-_1937202.jpg)

The 1911 census gives us a further snapshot of the family – Samuel aged 56 with a birth year of 1854/5, Eliza aged 55 with a birth year of 1855/56, young Samuel aged 20, now a tailor running his own business and shop; Flora, aged 18, helping with the domestic work; and Reginald, aged 11 still at school. Their accommodation, in the police station, had seven rooms 

Samuel Hicklin’s signature from the 1911 census

At Leek, Hicklin’s life seems to have continued in much the same way as at Burslem, no doubt the majority of the time being taken up by the administrative roles necessary in any large organization – appointments and promotions, finance and reporting and so on. It is likely that, as one of the four Chief Superintendents, he also played a role in the determination of strategy and plans for the whole constabulary under the direction of the Chief Constable. He continued to deal with much the same range of crimes and incidents as before, although it seems that the war years were rather quieter than previously, in part because licensing hours were restricted.  His first involvement with motor vehicle transgressions is recorded– a taxicab colliding with a horse and cart in 1918; and the death of a pedestrian after being knocked down by a car whilst disembarking from a tram. The war also caused a significant decrease in the number of public functions. One that did occur after the war in 1923, was the presentation of certificates to the 219 special constables who were in post in the Leek Division between 1914 and 1919, replacing those who had volunteered to enlist. 

During his time at Leek, two major honours came his way – the King George V Coronation Medal in 1912, and the MBE in 1919.

 The final mention of Hicklin in the press was on the 9thFebruary 1924 when he reported at the Annual Licensing Sessions of the Leek Division.

Chief Superintendent Hicklin reported that the number of licenses in the Division was 142, no license holders had been proceeded against under the licensing laws; 52 males and 10 females were proceeded against for drunkenness, all except 6 males and 4 females being convicted. 

As he began his career with drunken behavior, so he ended it.

Samuel Hicklin died on Thursday March 27th1924, having made his last court appearance on the Monday before, when he was in good health. This suggests that death was due to a heart attack or something similar. The obituaries were fulsome and generous. From the Staffordshire Sentinel of 31stMarch 1924.

…..During his 14 years at Leek, Chief Inspector Hicklin has made himself extremely popular with all classes but the courteous and tactful way in which he has carried out the important and various duties attached to his office. Of a quiet and unassuming disposition, and a man seeking little publicity, he was nevertheless a strict disciplinarian and his organization of the police in the large and important Leek Division was as complete and as efficient as anywhere in the county……. He was a zealous and efficient police official carrying out his work with conspicuous ability and whilst ever mindful of the responsibilities of his position, he was always fair and impartial in the preparation of prosecutions… 

He was also described as being in his 69thyear, implying birth years of 1855/1856. The tributes from magistrates and court officials were equally fulsome. In his obituary in the Staffordshire Constabulary Monthly Budget of April 1924 we read

The Chief Constable wishes to express his deep and sincere appreciation of the very valuable and loyal work of this officer during his long service of 48 years in the force.

In the same obituary his birth date is given, for the first time in the historical record, as 28th March 1857, which was probably one year earlier than his actual birth date.

Leek Parish Church (from https://en.wikipedia.org/wiki/St_Edward_the_Confessor%27s_Church,_Leek#/media/File:Leek,_church_of_St_Edward_the_Confessor.JPG)

His funeral took place on the afternoon of Monday 31stMarch. There was a procession of 100 officers, including many ex-officers who had served with him across the county from the Police Station to Leek Parish Church, led by six mounted constables. Chief Constable Anson also attended. At the service there were representatives from the two Freemasons lodges of which he was a member, many magistrates and court officials, representatives off the Licensed Victuallers Association (which seems wholly appropriate) and many others. The coffin was carried into church by six constables. After the funeral service led by the vicar, his body was laid to rest in Leek Cemetry. The mourners were recorded as 

Mr Reginald Hicklin (son), Miss Flora Hicklin (daughter), Mr and Mrs A Tipper (sister and brother in law) , Mr and Mrs T E Harper, Mr J Goode (nephew) and ex-Inspector George Oulton of Leek, formerly of Burton”. 

Sam Hicklin, the eldest son was stated to be in Canada. Mrs Tipper was actaully his half-sister Harriet. It is notable that Eliza was not present. In the pre-second world war register of 1939, she is registered as still living in Leek, with her unmarried daughter Flora, and as being incapacitated. Perhaps that was already the case in 1924. The Staffordshire Advertiser who reported on this event, also contained the only picture I can trace of Sam Hicklin – it is shown below.

Samuel Hicklin 1858-1924

Samuel Hicklin’s life was in some ways quite exceptional – that a farm labourer’s child should rise to perhaps the highest police rank that was available to him (as Chief Constable and Deputy Chief Constable ranks were largely restricted to “gentlemen” or retired military officers) must be viewed as remarkable, and a tribute to his abilities, hard work and diligence. From press reports it is not really possible to form a view of his character and personality, but he does seem to have been genuinely well liked and respected by his peers. The number of colleagues and acquaintances his funeral alone is testimony to that. 

Throughout these posts I have mentioned the rather variable birth dates that he assigned to himself through the years. This might have been in part due his own uncertainty about his age, but I find this explanation not wholly convincing in view of his precision in other areas (not least his pedantic interactions with landlords who keep their pubs open somewhat later than they should) and I would wonder if throughout his career he was careful to ensure that nobody came to realize that he gave a wrong age at the very start of it. A very small blot on the copybook of a remarkable man!

Part 1 – A (very) young constable 

Part 2 – Climbing the ladder  – from Sergeant to Superintendent 

A policeman’s life – Samuel Hicklin (1858-1924) Part 2

Part 1 – A (very) young constable 

 Part 3 – Chief Superintendent Hicklin 

Climbing the ladder  – from Sergeant to Superintendent

Bradley Green Police Station  (from Edina Digimap 1880)

Hicklin’s next move was to a completely different area – Bradley Green, near Biddulph in the Potteries District, where he took up a position as Sergeant 2nd class on December 1st1884. Perhaps oddly, as he scaled the promotion ladder, he becomes somewhat less visible, because of fewer court appearances and, one suspects, because the Congleton and Macclesfield Mercury, on which we rely for this period of Hicklin’s career, provided a less comprehensive news coverage than the County Express and County Advertiser between them for Tividale and Pensnett. But the necessity to deal with drunks and disorderly behavior continued, and we meet Hicklin in court a number of times proving cases of this type. In addition there are the usual incidences of petty theft and “furious” driving of horse and carts that needed to be addressed. He was also called to a number of suicides usually by hanging, then a criminal offence of course, and had to cut down the body. He was clearly becoming involved in more administrative duties, and we hear reports of him attending the Biddulph Local Board, and being given authority by that board to prosecute for “stone-throwing, swearing and dis-orderliness in the public street” on behalf of the Board.  

Of the more unusual incidents he had to deal with, perhaps the most distressing was that of Emily Poole of Hanley, who was very badly mistreated by her stepmother Priscilla Poole, a case which came to court in 1887. Emily was about 20, but looked much younger, and had been repeatedly beaten, left unfed with very little clothing, and was often required to work naked around the house. The neighbours, taking pity, gave her some clothes, but the step-mother pawned these. She slept in a damp, leaking garret room with very little bedding. Hicklin in giving evidence said he would rather sleep in the open air than in such a room as that. Over the past year Emily had tried to commit suicide, and Priscilla had continually abused the neighbours who remonstrated with her over step-daughter’s treatment.  The magistrate stated that this was the worst crime that he had ever had to deal with and sentenced Priscilla Poole to the maximum level he was allowed – six months in prison with hard labour. 

Perhaps the main incident that occurred during his time at Bradley Green, was in 1889 when he and one of his constables. PC Clay were charged with assaulting Samson Chadwick, a collier, in 1889. Chadwick had clearly been acting in a disruptive fashion in public, almost certainly due to drink, and PC Clay had tried to arrest him. He went with the PC quietly at first, but then began to resist. In a scuffle Clay threw him to the ground and tried to drag him, handcuffed, to the police station. Being unable to do so, he fetched Hicklin and another PC and between them they dragged Chadwick along the ground for three hundred yards to the station, in full view of the public.  At the station he was put into a cell, and was allegedly thrown roughly onto a bench, resulting in a black eye and other injuries. Witnesses testified that Clay kicked Chadwick on the ground while he was being dragged and that he did not have any injuries when he was put into the cell. According to Hicklin’s statement he was “laid very carefully upon the bench in the cell”.  Despite what appeared to be quite strong evidence that the police had been somewhat rougher than they ought to have been, and the less than convincing police statements, the magistrates conferred and decided in favour of the police.  And Samuel Hicklin was able to continue his career. 

The Hicklin’s third son Samuel was born in March 1891 and was baptized at Oldbury in early September. In the census of that year, Hicklin’s age had increased again to 36, giving a birth date of 1854/1855. In reality he was coming up to 33 at the time.  Eliza’s age was given as 35 and thus a birth year of 1855/56.

In November 1891, Hicklin moved directly from being a Sergeant 2nd class to being an Inspector 2nd class, thus jumping a grade. This involved a move to Burton upon Trent in the Rural District in 1891 and a subsequent move to Tipton, back in the Mining district for a brief period in 1896, at the same grade. Burton was of course near to his home, and the duties would have involved policing the area where he was born and brought up. In 1896 there were 17 Inspectors and 14 Superintendents in the Staffordshire Constabulary, which implies roughly one each per division. In this period of his career, Hicklin is at his least visible and the Burton Chronicle makes few mentions of him – too senior to be required to make many press-reported court appearances, but not quite senior enough to be the public face of the force. But where he does appear, the incidents he was dealing with were far removed from the drunkards of earlier years. At Burton in 1892, he rather wonderfully identified a shop-breaking suspect by comparing a boot print at the crime scene with the suspect’s boots – proper police procedure! In 1895, he was instrumental in the arrest of a fraudster on the run from the police in Oxford, having obtained jewelry by false pretenses; and in the same year, he arrested another travelling fraudster, who had pretended to be an old acquaintance of a number of leading cricketers of the day, now suffering from sickness, in order to obtain donations.  He moved to Tipton in early 1996 on what would seem to be a short term posting. The major incident that he was involved with there was the trial of Sarah Jane Williams (43) and Frederick Ward (49) were charged with the theft on significant money and property to the value of £400 from John Williams, Sarah’s husband, and then eloping via Liverpool to the United States.  Hicklin was entrusted with sailing to the United States in their pursuit and received them into custody on board the Belgenlandin Washington Docks, Philadelphia. It is to be hoped that he was actually allowed to disembark and see something of the USA after such a trip!

During their time in Burton, the Hicklin’s daughter Flora was born in Burton in August 1892.

Burton upon Trent and Tipton Police stations  (from Edina Digimap 1900)

On December 1st1896, Hicklin was appointed as a Superintendent (again jumping the grade) of Inspector 1st class and moved back to Burton upon Trent where he was in charge of the Burton Division, with 18 stations including Uttoxeter, Tutbury, Horninglow, Alrewas, Yoxall and Burton itself. By this time the Districts had been renamed –the Mining District as District A, the Rural District as District B and the Potteries District as District C. After the years as Inspector when his activities weren’t very visible, becoming the Superintendent put him very much in the public eye. Whilst he was no longer involved in arresting drunks he was responsible for licensing public houses, and had to report on an annual basis to the various licensing authorities in the area on the number of licenses, number of offences of drunken behavior, recommendations for granting or withholding licenses etc. He seems to have exchanged catching drunks for counting them! He can also be seen making reports to local council committees on various aspects of policing; attending fund raising functions, including kicking off a charity football match between Burton and Lichfield Police; organizing inspections of police forces; and attending funerals and delivering tributes. In short he became a public representative of the police in the area. 

He and his family lived in accommodation at the Police Station on Station Street, together with 8 police constables (presumably in some sort of dormitory facility) and for the night of the 1901 census, three prisoners in the cells. The picture below is from the Burton upon Trent History website and is captioned there as showing the newly appointed Superintendent Moss in 1898. Moss was actually appointed in late 1906 / early 1907, after Hicklin left Burton. So either the picture is wrongly dated and shows Superintendent Moss in 1907, or the picture is of Samuel Hicklin himself. I would of course like the latter to be true, but even if it is not, it does give clear indication of the sort of uniform worn by the Staffordshire Constabulary at the time. 

Description: Macintosh HD:Users:chrisbaker:Dropbox:Web site:Blog material:Hicklin:Pictures:Burton police andstation 1898 - superintendent Moss? or Hicklin.jpg

Superintendent Moss or Hicklin? (from http://www.burton-on-trent.org.uk/category/amenities/police/police1)

Some things however remained the same – he continued to bring malefactors to court for not being in proper control of their horse and cart, or for causing obstructions on the highway. “Reckless cycling” through the borough was also becoming an issue. The range of minor crimes he and his men investigated was very wide – for example house breaking, cruelty to animals, shoplifting, perjury, embezzlement and fraud, illegal betting, trespass and family maintenance defaulters. He also had to deal with a distressing number of suicides and attempted suicides. In general both Hicklin and the bench of magistrates were very gentle with survivors, and tried to place them in situations where they might find help.   

Amongst the most amusing of these minor incidents was the case in 1899 of the shop fire at Burton-upon-Trent where the owner, a Mr. joseph North, a draper from Uxbridge Street, was unable explain to Hicklin how the fire had started at around midnight and why he and his wife were fully dressed at that time after retiring to bed early. Hicklin, unsurprisingly, found the facts that Mr Richardson’s attire included collar and tie and laced up boots more than a little suspicious, particularly in the light of the fact that the level of insurance was about eight times the value of the stock that was burnt.  There was a further case in 1905, when Hicklin was able to solve a series of robberies that had been committed by Elizabeth Smith and Mary Parkes, through the initiative of a local shoe shop owner, who attached an enticing pair of slippers to a cord, leading to a mousetrap that was activated (presumably loudly!) when the slippers were taken. When Hicklin searched the suspect’s homes, he found, to quote his evidence “a cartload of stuff, including boots, shoes and clothing”. 

The ongoing series of relatively minor offences however were punctuated by major incidents of violence and murder, which naturally made the headlines in the local (and sometimes national) press. Of these two incidents stand out –the first that ultimately involved only minor injury, and the third that involved quite a complex murder investigation. Both were reported very widely in newspapers across the UK. In both, Hicklin showed himself to be much more than a desk bound administrator. 

In the first of these, in 1900, some children were standing on the Recreation Ground  canal bridge in Burton, when one of the boatmen on a passing barge shot at them from below with a pellet gun. Five of the children were injured in the face and shoulders. The incident was reported to the police in Burton and we read that Hicklin chased them for seven miles along the canal (presumably mounted) and then arrested them at Alrewas. The claim was made that the children had been throwing stones.  The three boatmen – Benjamin Nixon, Emmanuel Lloyd and Harry Banks- were charged with causing grievous bodily harm to the children. From the evidence presented it was not clear which of the three had fired the shots. They were committed for trial at the Quarter Sessions. From our perspective, the interesting aspect is that Hicklin, even at the rank of Superintendent, rode after them, and arrested them, knowing that they were potentially armed – an act of considerable bravery. 

We find a similar pattern in perhaps the major incident of Hicklin’s time in Burton.  On a Sunday morning, in late January 1903, PC William Price, based at Stretton near Burton, was investigating the stealing of some ferrets. His enquiries led him to a “gypsy” encampment consisting of several caravans, where he arrested a certain Tom Sherrif.  Sherriff’s two brothers John and William then attacked him with sticks and stones. When trying to use his baton, Price was repeatedly hit and forced to the ground where they continued to beat him. They eventually made their escape, despite the efforts of Price who tried to pursue them before collapsing. He was taken to Burton Infirmary and wounds on his head dressed. Later however at home he became delirious and was readmitted to hospital, where a fractured skull was diagnosed and an operation performed. Price however died later that night. It would seem that when Hicklin heard of the events, he drove (a horse and trap) and having driven through his home territory of Marston-on-Dove and Hilton, caught up with the caravans at Hatton, and arrested the group. He was assisted by a number of constables it would seem, although reports are a little vague. Those he arrested however, were the mother and father of the three brothers – Hope and Hattie Sherriff , who were traveling Hawkers, and another Hawker Arkless Holland, together with other younger family members.  The evidence that these gave at the inquest the following day suggested they were not involved in the assault although they did little to prevent it. The three brothers in the meantime were nowhere to be found and a search was instigated. Again the actions of Hicklin are interesting – driving after what could have been a group of very violent youths in order to make an arrest, with little support. The runaways were eventually sighted at Scropton about eight miles from Burton, but overpowered and maltreated the officer, Sergeant Hutchinson ,who tried to arrest them. Reports were later received of them being sighted in Derby and Belper. They were eventually captured at Buxton on Wednesday night and Hicklin and a Sergeant went by train to collect them, suitably handcuffed, on Thursday morning. They met with a hostile reception from a large crowd at Burton station, and were brought to court very quickly, where they were remanded in custody. At the County Sessions a week later the three brothers pleaded guilty to murder, but stated that their father and Holland were not guilty. They were all committed for trail at Stafford Assizes in March 1903. In the train on the way to Stafford Jail the three brothers were overheard discussing the fight with the Price by the constable accompanying them.  The charges against Hope Sherriff and Arkless Holland were not proceeded with at the Assizes due to lack of evidence, but the three brothers, who had changed their plea to not guilty, were found guilty of manslaughter, based partly on the overheard conversation on the train.  This sentence was possibly arrived at, as it was not possible to say which, if any of them, was actually responsible for the blow that fractured Price’s  skull and resulted in his death. They were each sentenced to 15 years penal servitude. In 1911 they were all held in the prison on the Isle of Portland.  Whether they were actually gypsies (i.e. Romany) or not is debatable, and they might simply have been travelling tinkers. The term “gypsy” however was clearly used in a derogatory way in much of the press coverage.

Samuel and Eliza’s time second period in Burton was not without personal trauma. Their two older sons, both in their twenties, died in that period – John in 1899 and William in 1904.  Their youngest child Reginald was born in 1899. In the 1901 census, Samuel’s age is given as 46 and Eliza’s as 43 and thus implying birth years of 1854/5 and 1857/58. At that time, William, aged 18, is recorded as an Engineer’s apprentice. 

In August 1906, Hicklin was promoted to the rank of Chief Superintendent, and left Burton with fulsome tributes from the Mayor, the bench of Magistrates and court officials and counsel. The tone of the tributes as reported in the press was warm and he seems to have been held in genuine respect and affection. 

Part 1 – A (very) young constable 

 Part 3 – Chief Superintendent Hicklin 

A policeman’s life – Samuel Hicklin (1858-1924) Part 1 (V)

A (very) young constable

Part 2 – Climbing the ladder  – from Sergeant to Superintendent 

Part 3 – Chief Superintendent Hicklin 

Description: Macintosh HD:Users:chrisbaker:Desktop:20181007_124704-20181007_124719-e1539761058221.png

The church of Hilton, St Mary’s (from https://stmaryshilton.org

Arthur Samuel Hicklin was born in Hilton near Marston-upon-Dove in Derbyshire in late March or early April 1858, to John and Ann Hicklin. John was a farm labourer in the area, but there are no further details available of where or for whom he worked. Arthur Samuel was baptized at Hilton church on 25thApril 1858 and was the couple’s fourth child. Of his siblings, Eliza was born in 1852, John in 1854 and Samuel in around July 1856. The latter died the next year in May 1857. They were to have a further child, William, in 1860 before John himself died in that year, leaving Ann a widow. Ann married again in the mid-1860s to William Long, another farm labourer from Hilton, and had two further children, Ann and Harriett. In the 1861 census, Arthur Samuel was referred to using his first name. After that he always seems to have been known as Samuel, or, one suspects, Sam. I will in general use either “Sam” or “Hicklin” in what follows. In 1871 he was no longer with his family, but was a thirteen-year-old general servant on William Loverock’s farm in Horninglow near Burton upon Trent.  Loverock was a major landowner in the area, and employed a number of men and boys on his farm of nearly 300 acres, as well as a number of domestic servants. Sam seems to have lived in a house adjacent to the farm (possibly Hodgkin’s Farmhouse although the census return is difficult to read), with a number of other servants, both male and female.  He thus probably only received the most rudimentary of educations, which makes his rise through he Staffordshire Constabulary that we will see in what follows the more remarkable. 

Possible location of Loverock’s Yard and Hodgkin’s Farmhouse in Horninglow (from Edina Digimap 1880) 

The Staffordshire Constabulary at that time was divided into three districts – the Mining district of the Black Country; the Potteries district around Stoke; and the Rural District for the rest of the county. This organization persisted, with some alterations of boundaries, throughout Hicklin’s career. At the head of the organization was the Chief Constable, based in Stafford. Each district was headed by a Chief Superintendent, one of whom served as Deputy Chief Constable. At times however the latter role was taken by a fourth Chief Superintendent. Each District was divided into Divisions headed by a Superintendent or Inspector, and each division into Sub-divisions, which included two or more police stations.

Sam joined the Staffordshire Constabulary in November 1875, when his age is given as 18 years and 7 months, implying a birth date of April 1857 – i.e. a year earlier than the actual date. There must therefore be a suspicion that he exaggerated his age in order to join the police. On entry to the force, he was described as being 5’ 8 5/8” tall, with brown eyes, dark brown hair and a fair complexion. His previous trade was given as labourer. He seems to have initially served in the Rural District, presumably in a training situation, possibly close to his home. In January 1876, he was the subject of a disciplinary charge for being drunk at the time he was meant to be on duty – and thus seems to have been aa fairly normal 17 year old. He was fined one shilling. He was then stationed at Tividale in the Black Country and thus continued his career in the Tividale station in the Blackheath Sub-division of the Brierley Hill Division in the Mining District.

His life at Tividale would have mirrored that of young constables anywhere. His first appearance in the press seems to have been in the County Advertiser of April 1st1876 which contains the following report of the proceedings of the Rowley Regis Magistrate’s court. 

Isaac Fisher was charged with being drunk on the 25thult., and pleaded guilty. Police Constable Hicklin proved the case, and the defendant was fined 5s with costs.”

Dozens of similar mentions appeared over the months and years that followed, mainly in the County Advertiser and County Express, as he rose from Constable 3rd class on appointment, to Constable 2ndclass on 1stAugust 1876 and Constable 1stclass on 1stAugust 1877. So he was clearly well regarded for his dealings with drunkards. To add a little variety, we also read of him apprehending carters driving too quickly or not exercising proper control over their horses; children stealing coal; bringing publicans to court for selling out of hours or for encouraging drunkenness; and (perhaps the highlight of his time in Tividale) bringing Joseph Evans and Benjamin Baker to trial for shooting ducks on the canal at Brades Village. Not all went totally smoothly however, and in May 1876 he faced another disciplinary charge for being absent from a “conference”. Again he was fined one shilling. But this clearly did not impede his progress.

Brades Hall locks (from https://en.wikipedia.org/wiki/Gower_Branch_Canal#/media/File:Brades_staircase_locks,_Gower_Branch.jpg)

During his time at Tividale, his private life was probably more interesting than his professional life. In that period Sam met and married Eliza Taylor, the daughter of the boat builder John Taylor at Brades Hall locks on the Gower Branch of the BCN. They were married at Christchurch, Oldbury on 10thFebruary 1878.  Here, for what seems to be the last time, the name Arthur Samuel was used in the registers. Both he and Eliza were recorded as being 20 at the time, which at least for Samuel, was not the case. Eliza was baptized in August 1858, so should only have been 20 at the time if there had been a significant delay between her birth and baptism, but she could well have been born in late 1857 or early 1858.  Perhaps at this point Sam was finding it necessary to continue the minor deceit concerning his age.  The couple were to return to Oldbury for the baptisms of their children John in 1880, William in 1883 and Samuel in 1991. 

Christchurch Oldbury  (from http://www.historyofoldbury.co.uk/2story.htm)

In late 1879, Hicklin moved to a new posting in Pensnett – still in the Brierley Hill Division, but also in the Brierley Hill Sub-division. The head of the Division, Superintendent John Wollaston was based at Brierley Hill police station. The census record indicates that in 1881 Samuel and Eliza lived on Commonside (almost certainly in a police house) with their baby son John, and Police Constable Edward Wynn as a lodger. Their age inflation continued, with Samuel giving his age (in early April 1881) as 24, which implies a birth year of 1856/1857, and Eliza being 23, with a birth year of 1857/58. The move also coincided with a “merit” award on 1stJanuary 1880.

Brierley Hill Police Station and Magistrates Court (from http://www.brierleyhill.org/blog/2014/08/04/brierley-hill-on-the-day-war-broke-out-and-the-departing-of-the-first-tropps/and Edina Digimap 1880)

In many ways, Hicklin’s life in Pensnett was very similar to his life Tividale – the large majority of the cases he took to court were charges of being drunk and disorderly, with the next most common being coal stealing, other petty theft, “furious” wagon driving and so on. But there were a number of other notable events. On the 26thof October 1880, Hicklin and another policeman, concealed themselves at a pit in the Wallows area, and watched a large crowd of mainly women and children picking coal from that stored at the pit. When the constables emerged from their hiding place, all the coal pickers ran away, but most were apprehended later, having been identified. In total 26 were brought to caught with ages ranging from 11 to 61. All were fined between 2s 6d and 5s, or 7 to 14 days in prison. The report ends with the rather sad note that “the charge against May Angel (13) a deaf and dumb girl, was withdrawn”.  

He also continued to come into conflict with publicans for failing to keep hours. Almost as soon as he arrived at Pensnett, on Christmas Day 1879, he visited the Sampson and Lion and found them still serving at 3.00 in the afternoon – half an hour later than should have been the case.  The whole case hinged upon whether or not his watch was correct, or whether the landlord’s clock was correct. After much discussion the bench dismissed the case, on the grounds of the landlord’s respectability and the fact that there seemed to be no intention to remain open. Hicklin’s zealousness probably did little to endear him to his local pub landlords. In a similar way, he charged the landlord of the Rifle in March 1881 with selling beer after hours, Hicklin and a colleague having concealed themselves behind the pub to observe. This time the case was proven and the landlord fined. 

There were further instances. Early one Sunday morning in October 1881, he heard voices from a house close to the High Oak public house at 2.00 on a Sunday morning, and (after secreting himself in the door of the post office) saw a group of women coming from that house to collect ale from the High Oak to take back to the house. After they had entered and then left the pub, he confronted them and found ale in their possession. Despite a raft of excuses made to the bench, the landlord of the pub, William Evans, was found guilty of keeping his house open during prohibited hours. On another occasion in December 1881, Hicklin and the main witness to drunken behavior at the Fish Inn (Cornelius Chambers, one of the leaders of the teetotaler movement in Pensnett) were challenged in the court by the defense solicitor Mr. Waldren as to whether or not he was teetotaler, in such a way that implied they had an animosity towards the sale of alcohol in any form. Hicklin admitted he was a teetotaler, but denied that he had signed any pledge, and had no intent to do so. A similar challenge by Mr. Waldren was made in a case in 1883 concerning drunken behavior at the Crown Inn on Commonside, which was bluntly rebutted by Superintendent Woollaston on Hicklin’s behalf.He had clearly changed his ways somewhat since his initial charge for drunkenness in 1876.

The local animosity came out into the open in the middle of December 1981. Hicklin and a colleague, PC Lafford, assisted in throwing out four people from the Crown Inn on Commonside. He then went to the King’s Head Inn along the road to see the landlord there to ask him to serve on a Jury. As he entered, a man on a bench behind the door hit him a nu. mber of times with a stick, and a second man assaulted him with a poker with a blow across the shoulders. Lafford left to find assistance. When Hicklin recovered from being stunned he found his assailants and two of their friends had disappeared. Eventually Noah Bate, a miner from Commonside was arrested and brought to trial in March 1882. It would appear that Bate and the other three were those who had been thrown out of the Crown earlier. He was sentenced to jail with hard labour for two months. At that time, Hicklin was still suffering to some extent from the injuries he received. The story did not end there. On his way to the prison in Stafford, Bate was heard to say (by the accompanying Police Constable) that he would “do for that _____ Hicklin” when he came out. He was further charged with using threatening behaviour and bound over to keep the peace

Kings Head 1997 (from https://www.longpull.co.uk/downloads.html)

 Finally the last case that is worthy of note is an instance of forgery from 1882.  Hicklin was asked to check that the signatures on testimonials provided by an applicant to be a constable were valid, and he showed that two of them were forged. One suspects that this must have been a slightly uncomfortable experience for one who did not tell the whole truth on his application to the police force!

Part 2 – Climbing the ladder  – from Sergeant to Superintendent 

Part 3 – Chief Superintendent Hicklin 

The Earl of Dudley’s Railway – Accidents and incidents

Preamble

“Countess”, delivered to the Pensnett Railway in 1859

Elsewhere on this web site and in “Kingswinford Manor and Parish” I have written about the Pensnett or Earl of Dudley’s Railway, which developed in the mid-nineteenth century from the original Kingswinford Railway to carry coal and metal products around the Brierley Hill, Pensnett and Kingswinford area. It was centred on the Round Oak Iron Works, but extended to Ashwood in the west, Baggeridge in the north, Saltwells in the east and Cradley in the south. Along with others who have written on the subject, I have primarily concentrated on the development of the system and the industry it served. However, the railway was an integral part of the local society, and impinged on the inhabitants in ways both good and bad. In this post I want to present some information on how the wider public perceived the railway, from a keyword search of the British Newspaper Archive for the phrases “Pensnett Railway”, “Earl of Dudley’s Railway” and “Kingswinford Railway” from the opening of the Kingswinford Railway in 1827 up to 1920. The extent and quality of this information is thus wholly dependent upon what the local newspapers thought it worthwhile to report on. As is the way with press reports, the material primarily concerns accidents that often resulted in inquests presided over by a coroner, or criminal activity that found its way to the local police and magistrate’s courts. We will thus consider firstly accidents on the railway, both to its workers and to others and then move on to consider criminal cases associated with the railway, principally small scale stealing of coal, but also some more serious incidents. 

Accidents and inquests

Round Oak Iron works showing Pensnett Railway in foreground

Accidents to railway workers were by no means unusual, and occurred throughout the period being considered. One major cause of accidents involved workers being run over by the trains, either through failing to see a train approaching, or through slipping from the train itself. For example, in the County Advertiser of 15/9/1877 we read that Thomas Jones, a labourer at the Wallows, was on the railway just after a possession (a flag) had ended, and was not aware of a train of 13 trucks approaching him. 

“The buffer of one of the trucks struck him and rolled him over. The wheels of six trucks went over him and he died in about five minutes”.

And from the County Express of 21/6/1910 we read of Richard Teague, aged 60, who worked on the incline between Level St. and Saltwells.

“…. several trucks loaded with ironstone had just reached the summit, when he attempted to disconnect the rope from the first wagon. He slipped down, and in a moment his body was cut in a frightful manner by the wheels, death being instantaneous.”.

Shunting was also a hazardous occupation, and there were a number of incidents of workers being crushed between wagons. From the Staffordshire Sentinel of 15/9/1877, concerning John Small at Sandfield Bridge.

“…the trucks did not stop at the proper time and he was crushed against a wall….. in a space of eight inches and was frightfully mangled…”

From the County Express of 28/5/1910, concerning Benjamin Parker (24), a shunter at Round Oak, 

“…both his legs were caught between the wagon and locomotive, with the result that they were frightfully smashed, and a thigh and a leg bone broken…”

There were also accidents to those other than railway workers. The most common seem to have been to children (almost always boys) who tried to jump on or off a moving train for a free ride. In the County Advertiser of 30/4/1904 we read that nine-year old Samuel Oakley of Lower Church St, Pensnett attempted to mount a train on the Barrow Hill incline, but slipped and fell beneath the train

“Two of the trucks passed over him and when the train had been stopped it was found that both legs had been severed from the body and his right arm and hand were terribly crushed”

He died soon afterwards at the Guest Hospital.  In the Dudley Chronicle of 17/6/1916, we read again of children from Church St. in Pensnett – Robert Clowes (14), George Adlington (14) and Thomas Downey (12). They jumped onto a train of empties on its way to Baggeridge. After riding some distance, Downey jumped off, and turned to see Clowes and Adlington disappear through the bottom frame of the truck. Clowes was killed and Adlington seriously injured, one of his arms being badly mangled. 

Much of the railway was used as walking routes by those in the locality, and inevitably this could lead to accidents. In 1882 George Shakespeare (13) had walked along the railway with a friend, Isaac Hardwick, who was taking supper to his father at the Round Oak works. As many readers will be aware one of the idiosyncrasies of the Pensnett Railway was that it crossed the GWR main line at Round Oak on an extended flat crossing across six or more tracks.  When the two lads were using this crossing, George missed the approach of an express train from Wolverhampton, and he was “swept down by the express” ((County Express 21/1/1882). We read further

….when the train had passed the lad was found to be quite dead, the top of his head being crushed to pieces and his brains scattered about the place”. 

If an accident resulted in a fatality, an inquest was held within days at a local public house under the jurisdiction of the coroner, with a jury drawn from the locality. For example for George Shakespeare, the inquest was held in the Commercial Inn in Bromley. The verdict for accidents of the type described above was nearly always “accidental death” with little blame being attached to employer or operator.  In the early days these seem to have been relatively informal affairs, but in the early twentieth century, there was a greater level of formality, with factory inspectors often involved, and the Earl of Dudley being represented by legal council. 

Not all accidents resulted in injury to either workers or local residents. In 1916, Charles Mace, an engine driver, was shunting trucks in a siding near Tansey Green, when a number of trucks ran into the engine and through him off. The driverless engine and its coke trucks then ran for about a mile towards the Stallings Lane crossing where it derailed  (Dudley Chronicle, 28/1/1916). The report also notes that 

“It is a curious fact that the same engine, in charge of the same driver, was overturned at the same spot sometime ago.”

Curious indeed. Finally, it is worth mentioning the accident that received the most press coverage of them all, the same text being reported in newspapers the length and breadth of the country. Naturally it involved animals rather than humans. We quote the Worcestershire Chronicle of 6/11/1867 in full.

“On Friday evening at the Earl of Dudley’s railway at the Old Park  Coliery near Dudley, a singular accident occurred. Mr Phineas Parsons, a farmer of Pensnett, has the  right to run his sheep on the pasturage near the Old Park Colliery; and on the night in question one of Mr. Parson’s men proceeded to drive a flock of 65 sheep from one portion of the land to another, and in doings o the whole flock got onto the tramway. A couple of trucks, loaded with coal had been started in charge of one of the men down the incline, and these trucks overtook the sheep in a narrow cutting, and the consequence was that 23 were killed on the spot, and six others were so mutilated as to render it necessary to slaughter them at once. “

Phineas Parsons worked Hollies Farm (1872 Post Office Directory), so it is natural he would have pasturage rights in the Old Farm area nearby. It is not however clear which incline is referred to here – the Barrow Hill incline seems too far away from Old Park to be the incline in question, so perhaps there was a smaller incline within the Old Park colliery complex itself. 

From Facebook post by Dave Fisher, photograph by Roger Shenton. If further acknowledgements are required, please let me know. The likely site is at the bottom of the Barrow Hill incline.

Crime and punishment

The stealing of coal was endemic in the area in the nineteenth and early twentieth century, both from pits themselves and the railway, and scores of incidents are reported in the press.  This perhaps reflects the relative poverty of the area , as well as the easy availability of coal. Those involved were of all ages, although children and young adults were in the majority, with the magistrates court imposing fines of between 5s and £1 or 7 to 14 days imprisonment. In 1916 the local Superintendent of Police complained in court that “the local people went and fetched the coal away as though they had a right to it” (Dudley Chronicle 15/1/1916). Marxist historians would no doubt agree that they did, as the land from which the coal came had been common land on Pensnett Chase until a century before, when the rights of commoners had been extinguished by the Pensnett Chase Enclosure Award, and ownership of all underground resources had been “stolen” from the locals and given explicitly to the Earl of Dudley. Whether or not one accepts this analysis, it is hard not to feel sympathy for some of those arrested for coal stealing. For example Letitia Garbett (63) of Lower High St, Pensnett  was fined £1 for stealing coal from the railway, or fourteen days imprisonment. She complained she had no money and would have to go to prison in her old age (County Express 25/11/1911). Similarly, in 1916 Oswald Smith (11), Mary Parkes (12), Albert Beddard (10) and Alice Timmins (10) all of Chapel St Pensnett were caught with small amounts of coal in their possession by the local constable, and their parents were each fined 10s, or 6 days imprisonment if they could not pay (Dudley Chronicle 22/4/1916). 

Many of those brought to court were serial offenders. For example, Edward Jones (16) from Pensnett was said at his trial in 1881 to have been convicted six times in the previous four years, and was lucky not to be sent to the Quarter Sessions. He was imprisoned for six weeks with hard labour (County Express 31/12/1881). A year later Caroline Pulley (32), who was sent to prison for two months, was said to have nine previous convictions (Birmingham Daily Post 13/6/1882). 

One particular area of activity seems to have been the Queen St / Church St / Chapel St area of Pensnett, with many defendants coming from that area.  At the same hearing where  the elderly Letitia Garbett was sentenced, Eliza Wilde of Queens Lane, Pensnett was fined 10s; Barbara Watkins of Church St was fined £1; Gertrude Barker of Church St and Mary Hunt of Lower Church St were fined 5s each. This might be simply due to press reporting giving a false impression of the prevalence of crime in the area, but it may also be due to the assiduousness of the local night watchman, Josiah Hickman. He lived at Woodside and is recorded a number of times in the press as “proving cases” against a wide variety of offenders.  As an example of his modus operandi, we have a report in the County Express of 9/4/1910 of him lying on the ground somewhere around the end of Church St., waiting for Joseph Westwood to leave his home 50 or 60 yards away. The latter picked up a large chunk of coal from a truck on the railway (weighing about half a hundredweight), before Hickman detained him by putting his stick around his neck. Westwood managed to struggle free. It would seem that Ellen Horton was also in the area and tried to warn Westwood when Hickman appeared, shouting “Hey Up, Joe”. Westwood was fined 10s and Horton 5s for aiding and abetting. 

There are also indications of more organized activity. In hearings in 1916, several dozen women were charged with coal stealing from the Wallows area, where, it was said in court, the average loss on that part of the line was 25 to 30 tons per week (Dudley Chronicle 29/1/1916). It seems that there was an elaborate system of pickets to warn of approaching constables or watchmen. If any were caught and fined, then the fines were covered by a whip-round of all those involved. It was revealed that in total there were 215 convictions for coal stealing at Brierley Hill magistrates for the year ending January 24th1916, 57 involving children (and their 57 guardians who paid the fines), 90 involving women and 11 involving men.  For all involved at the cases being heard that day the sentences were quite severe – a 25s fine, or 21 days in jail. It was clear the magistrates were significantly swayed by the fact that most of the women were in receipt of army allowances, as their husbands were in the forces, and were thought well able to afford to buy coal.

From time to time the minor criminality associated with the railway took on a more dangerous form. Of particular concern was deliberate vandalism by youths. In 1906 Hezekiah Price and Joseph Rider (both of Lower Church St. again) were charged with moving points and putting a brick between the rail and the points in order to derail a train. Although they claimed they were only playing, the magistrate took the matter very seriously and sentenced them to six strokes of the birch each (County Advertiser 22/9/1906). In a similar manner in 1913, George Treadwell (11) and Percy Treadwell (10) of Vine St, Hart’s Hill were charged with tampering with points at Round Oak, through the insertion of a brick. This time it actually resulted in a derailment of truck, with the brakeman on the buffers of the truck being thrown off, and the tearing up of 30 yards of permanent way.  

At the other end of the railway in 1914, Albert Greenaway (10) and Joe Andrews (10) of High St., Wall Heath, were charged with releasing a truck at the top end of the Ashwood incline by tampering with its brakes (Dudley Chronicle 9/5/1914). Fortunately nobody was injured, although the seriousness of the offence was stressed. On hearing that the boys had already been whipped by their fathers for the offence (which, said the magistrate, “was the proper thing to do”), the boys were discharged and ordered to pay costs of 7s 6d each only.

Some of the components of the railway of course were worth stealing in their own right. In 1906, Josiah Hickman caught two brothers from Low Town (near Holly Hall), James and Joseph Bagley, removing “keys” from the line – wooden pegs used to attach the rail to the chair. 18 were removed in total to a value of 3s. The brothers were fined 21s each, or a month in jail. The railway also carried valuable items of course other than coal. In 1917 there was a spate of thefts from trucks on the railway, but no culprits could be found. It seems that a trap was set, and two constables kept watch under cover on some trucks laden with “sharps” near Sandfield Bridge (Dudley Chronicle 3/11/1917). They waited from 3.00 in the afternoon, till 1.00 the next morning. Whilst they were watching, at about 12.50am, they saw Harry Darrell (20) a bricklayer of Smithy Lane, and Joseph Mason (45), a stallman from somewhere in Pensnett, make two visits to the truck to remove two bags of sharps. After the second bag was removed, Darrell was seized, but Mason ran away. On following him home, they found the other bag of sharps there, along with stolen bags of flour.  Similar bags of flower were found at Darrell’s home. The constables were commended by the magistrate for their actions.  Both Darrell and Mason pleaded guilty and asked for their previous exemplary character to be taken into account. Unfortunately, and frustratingly, the quality of the copy of the report in the BNA becomes very poor at this point, so I am unable to say what the magistrate made of the plea!

The oldest world record (V)

Cricket in the 19th century

Perhaps the oldest sport world record still current is that for “Throwing the Cricket Ball”, with the record being listed in Wisden’s Cricketers Almanack as 140 yards 2ft by Robert Percival on Durham Sands Racecourse around 1882. The length of the throw, and the inability of any others to throw that distance over the last 140 years, has resulted in considerable scepticism concerning its veracity and reliability. As a result of a recent newspaper article about Percival’s throw (Guardian 23/4/2019), the author began to consider whether it would be possible to actually calculate the flight of a cricket ball given certain assumptions about throwing speed and angle of throw and the like, and perhaps to come to some more quantitative conclusion about whether or not Percival’s throw was possible. This paper presents the results of these calculations, together with a historical survey of “Throwing the cricket ball” competitions, and an examination of the events (and in particular the weather) on the day the record was set. 

We begin by setting out some of the background for the event at Durham Sands “around” 1882 (it will become apparent why quotation marks are used in what follows), give a brief discussion of the event itself, and then move on to discuss the results of flight trajectory calculations (in very broad terms) before coming to some sort of conclusion about whether Percival’s throw was possible. 

Throwing the cricket ball as an activity has a long history. In 1792, Mark Richmond, gamekeeper to the Duke of Richmond, threw 119 yards at Goodwood Park to defeat the Earl of Winchelsea “who had never before been beaten” (Hampshire chronicle 3/6/1820).  In the 1820s, contests were vehicles for wagers amongst gentlemen (Morning Chronicle 25/12/1822). As an athletics event it was popular at sports days in the mid- to late Victorian era, along with other events that sound strange to a modern ear, such a place kicking and drop kicking for distance and target throwing with a cricket ball at stumps between 20 and 50 yards away (for example, see the Luton Times and Advertiser 29/5/1855). However, throwing the cricket ball did not ultimately make it into the list of accepted sports for athletic events and its popularity waned. This is illustrated by the histogram of figure 1, which shows the number of mentions the phrase “Throwing the cricket ball” receives in a search of the British Newspaper Archive by decade from 1800 to 1950. This is hardly a valid statistical approach, since it depends upon the vagaries of press reporting, but is nonetheless illustrative. After around 1900, the event goes into sharp decline and by the middle of the century is confined to school sports days. It seems odd that such a simple throwing sport did not ultimately find favour at an international level, as it seems one of the most physically natural of all events and one can speculate on the reasons. Perhaps it was because throwing the ball is not really a stadium sport, as the throws are too long to conveniently fit within athletics tracks;  or because it was not included as an Olympic sport.

Figure 1 Search results for “Throwing the cricket ball” in the British Newspaper Archive

The BNA is also useful in enabling us to get some idea of how competitions were conducted and how far a cricket ball could be thrown. The competitions usually involved between two and four throws per competitor, presumably from behind some sort of throwing line. Sometimes the throw was from the top of a barrel to ensure that there was no overrunning. On occasion, penalties in terms of a set number of yards were applied, presumably for overrunning the line, and some competitions were run as handicaps (Sporting Life 12/16/1878). There is even one record of a competition where the ball had to be thrown in the left hand, won with a throw of 38 yards, presumably with no natural left hand / arm users taking part (Sporting Life 25/10/1862). Figure 2 shows the winning lengths for throwing the cricket ball events between 1860 and 1900 from “The Sporting Life” published in London, but with a national reach, and for papers published in Edinburgh during the same period. This represents only a small proportion of all the newspaper reporting, but is at least geographically representative. In general, only those results from senior pupils in school sports; from University sports; from military competitions; and from Athletics Clubs have been used. Length of throw is given in yards, in deference to historical usage, although all other units in this article will be the S.I. units in which the author (an engineer) would normally work. 

Figure 2 Length of throw from The Sporting Life and Edinburgh newspapers 

The results, although again statistically rather suspect, are nonetheless illustrative.  The London and the Edinburgh datasets are consistent with each other, with competition winning lengths through the period were around 80 to 110 yards. The school sports results tend to be at the bottom end of the range, and the student, military and athletic club results being at the higher end. There are a relatively few results above 110 yards, and the recorded limit seems to be around 120 yards. However there were a few reports of longer throws. A letter in the Dundee Evening Telegraph of 9/1/1889,reports that a Mr. Fawcett of Brighton College threw 126 yards 6 inches (or possibly 127 yards 4 inches – two figures are given). Much later, the Nottingham Journal of 18/3/1925 gave the information that, in 1873, W. H. Game of Oxford University threw 127 yards 1 foot 3 inches; in 1876. W. F Forbes threw 132 yards at the Eton College Sports; and in Dundee in 1882, A. McKellar threw 130 yards, 1 foot 6 inches. There is also the (almost inevitable) report of the omni-competent W G Grace’s prowess in this field, with a throw of 122 yards (Edinburgh Evening News 10/8/1895). Wisden itself lists two throws of similar distance to that of Percival – in 1872, Ross MacKenzie is said to have thrown 140 yards and 9 inches in Toronto, and on December 19 of that same year “King Billy the Aborigine” threw 140 yards at Clermont in Queensland. 

Now let us consider the world record event itself. The Sportsman magazine in 1889, states that it took place in 1884 at Durham Sands Racecourse (Sportsman Magazine, 3/1889). However, Rayvern Allen as reported on Cricinfo, states that this is a mistake and that it took place on Easter Monday April 18thin 1882. Something has clearly gone wrong in the transmission of information however, as Easter Monday in 1882 was on 10thApril. It was however on the required date in 1881, and the event is duly mentioned in the report in the Durham County Advertiser of 22/4/1881. Durham Sands Racecourse, was, and is, a large stretch of level ground next to the River Wear in Durham. It is shown on a map from the 1860s in figure 3. It is basically oriented east to west along the river.

Figure 3 Durham Sands Racecourse in the 1860s (from Edina Digimap)

1881 was the first year of the Sands Sports and was bitterly cold (in the author’s experience, typical of an Easter Monday on whatever date it occurs in whichever century one might be in) with a moderate easterly wind. This will be seen to be of some significance in what follows. There was a significant crowd, but visibility of the events was poor, and there was only one small stand that was poorly occupied. In addition to the Sports “there were a good number of shows, roundabouts, shooting galleries etc, …while two quadrille bands provided unlimited pleasure to numbers of young people and dancing was freely indulged in”. There was a short and rather cramped 300 yard track that was used for a horse races  – flat races for horses above 14 hands, for ponies below 14 hands, and a hurdle race for horses, all with an entrance fee and cash prizes for the winners and placed horses. For human competitors the events were a 220 yard flat race, quoits, high leap, 220 yard hurdle race, long leap, donkey race, pole leaping, put stone, one mile walking competition, 100 yards boys races, a mountebank race (!), an open flat race, and, of course, throwing the cricket ball. All had prize money for winners between 7s 6d and £1. The prize for throwing the cricket ball was the lower value. The results of the competition are simply stated as follows.

1stPercival, 2ndGnatt, 5 competitors

No throwing distances are given. It would seem that Percival was something of an expert in this event, and won many prizes, and thus supplemented his earnings as a miner quite well. At the time of the throw he was 25 years old. The census records give contradicting birth locations – Alston (1861/1871), West Auckland (1881/1891) or Northead (1901/1911).  In 1881 he lived with his family in East Thickley in County Durham. In the years following he was often to be seen at open weight wrestling competitions and was thus clearly a strong and well-built individual. The Cricinfo report of Rayvern Allen’s work suggest that in October 1884 he won £10 in a wrestling competition at Durham Sands – hence the confusion about the date of the Throwing Event. The author has not been able to trace any reference to this, but Percival did win a best of seven falls wrestling match worth £10 against G Stockdale of Spennymoor, at Wood View Gardens, Tudhoe Grange in October 1884, so again there is possibly some confusion in the transmission of information (Durham County Advertiser 24/10/1884).  He was married to Mary, and they had 6 children. In the mid 1880s and early 1990s he was firstly the professional at New Brighton CC and then  groundsman to Liverpool Police Athletic Society. But by the early 1900s he was again a miner and died in South Shields in 1980 of broncho-pneumonia. There was no obituary. 

In terms of the claim for a world record length, the Sportsman magazine in March 1889 stated that it took place on Easter Monday, 1884 (3 years too late) and “the throw was measured by the committee“. In 1897 Sporting Records was more skeptical writing “It has been claimed by R Percival that he threw 141 yards at Durham Racecourse in 1884, but this is regarded as so doubtful that few authorities even mention it.” Note that Percival himself seems to have been making the claim, and it was clearly contentious even at that stage. The record was not listed in Wisden until the 1908 edition. Also note there were other claims to the world record around at that time – on 8/11/1889 the Sporting Life reported that in Australia a certain “Crane” threw 128 yards 10½inches, beating the world record by 2 yards and 7 inches, in a competition with a touring American baseball team. Who set the “old” record, and who designated it as such, is not clear. 

So it can be seen that while Percival’s claimed throw is very much above the run of the mill competition winning throws of around 80 to 110 yards of the period, there are a number of other recorded throws of rather greater distances, and Percival’s throw seems to be at the upper end of what was possible. However, its claim to be a world record has always been treated with skepticism. Can any more be said about the likelihood of him being able to make such a throw? We thus move on now to briefly consider the trajectory calculations. They are described in a little more detail in the Appendix for those who are interested.  In simple terms the calculations use Newton’s laws to determine the trajectory of the cricket ball, allowing for air resistance and the somewhat peculiar aerodynamic properties of the cricket ball. The maximum distances are always achieved at an initial throwing angle of around 40 degrees (so the trajectory is rather like that of a javelin rather than the normal cricket throw). This results in trajectory heights of the order of 30 to 40 m. Figure 4 shows the maximum distances achieved against initial throwing speed for a new cricket ball and an old cricket ball, for no wind. Paradoxically the aerodynamic resistance of the latter is less than that of the former (just as dimpled golf balls have lower drag than smooth golf balls), and this is reflected in the distances travelled. To give some context to the throwing speeds, 40m/s (≈90mph) is the bowling speed of a current international fast bowler – but as the throwing angle and ball orientation needs to be precisely controlled, this is probably less than the maximum speed obtainable in a less controlled throw. Major League baseball players have been known to throw at up to 50m/s (≈110mph). From this figure one can conclude that, at least in still air conditions, an old ball and a high initial speed are necessary to approach the 140 yard mark. One might expect that it would be normal to use a used ball in such competitions rather than waste a new ball.

Figure 4 Calculated length of throw against throwing speed for old and new cricket balls

However, as noted above, on the day of Percival’s throw it was somewhat windy. The wind speed increases with height above the ground, and this effect has been modeled in the calculations using the same methods as would be uses in calculating the wind load on buildings in modern structural engineering codes of practice. Figure 5 shows the calculated contours of throwing distance for an old ball, plotted against initial throwing speed and wind speed at 10m above the ground, assuming a following wind. The annual average wind speed in England is of the order of 4 m/s at 10 m above the ground. It can be seen that wind speeds above the average can have a significant effect on the throwing distances at any one throwing speed. In particular a 6m/s following wind will allow a throw of 140 yards to be achieved with the same initial throwing speed as a 120 yard throw with no wind. These calculations show that the trajectory of cricket balls are much more sensitive to wind conditions than, say, javelin trajectories, largely because cricket balls are aerodynamically bluff rather than streamlined

Figure 5 Contours of length of throw plotted against initial throwing speed and wind speed at 10m height.

Now the wind conditions on the day of the throw can actually be quantified with some precision. The Durham University Observatory(figure 6), which has the second oldest sequence of continuous meteorological measurements in the world after the Radcliffe Observatory in Oxford, is just over 1 km away (see figure 3). Prof Tim Burt of the University Geography Department, who now has charge of the Observatory, has kindly provided the author with meteorological data for April 18th1881. Basically the wind speed that day, at the 10.00 observation, was 6 m/s from the north east. This is probably a mean value and one might expect gust wind speeds to exceed this. Presuming this was a direct following wind (and there is no indication of the throwing direction on the day, but somewhere in the east / north east quadrant is quite possible looking at the layout of the Sands) then this level of wind speed couldhave significantly assisted the throw, although, there can be no certainty on this.

So what then are we to conclude? Robert Percival was clearly one of the top throwers of the age judging by the number of competitions he won, and his wrestling activities suggest considerable innate strength. It seems to the author that, there is a prima facie case that he would have been capable of propelling the ball at the necessary speed for a 120m plus throw of an old cricket ball in still air. The conditions at the Sands on the day of the record were such that the winds may have given him considerable assistance. A throw of 140 yards seems a realistic possibility. That such a throw is possible is further confirmed in Wisden which lists a number unverified, throws of around the 140 yard mark in recent decades (in particular Ian Pont, in Cape Town in 1981 was said to have thrown 138 yards) and an unverified world record throw has appeared on Youtube.

Figure 6 The Durham Observatory

Before we conclude, some other points come to mind. 

  • Firstly the press reports tell us that on the day of the throw the conditions were quite chaotic at the Sands, with a considerable crush of people, and there was difficulty of finding space for the events themselves.  This would hardly have made for accurate measurement of the throw and perhaps gives pause for thought as to the accuracy of the measurements.  
  • Secondly, can a throw be described as a world record if it is heavily influenced by wind conditions, as the calculations suggest was the case on Easter Monday in 1881?  This point of course is a general one that reflects on the actual integrity of all results for throwing the cricket ball as the required ball trajectories are quite high and can be expected to be affected by the wind even on relatively calm days. 
  • Finally was there perhaps an anti-north, anti-working class bias in the reporting – most of the athletics reports between 1860 and 1900 concentrated on the activities of the public schools, the military and the southern clubs, and the exploits of a miner in an open Durham meeting would not be likely to gain great acceptance. Perhaps this is partly why there was a reluctance to accept the record? 

Appendix. More details on the flight calculations

The author has reported calculations of cricket ball trajectory in normal play in “A unified framework for the prediction of cricket ball trajectories in spin and swing bowling”, and the method that was developed in that paper will be used here .  The aerodynamics of cricket balls is quite complex and varies depending upon whether the ball is new or used. Basically there are three aerodynamic forces acting on the ball – the drag, the lift force due to the spin of the ball, and a side force due to differential separation on either side of the ball because of the presence of a seam. The force due to spin is only of relevance at low-ball speeds and will not be considered here. Similarly the side force relies on the seam of the ball having a fixed orientation to the flow, and a spin to stabilize it. Neither of these will be possible in a long throw, and thus this force will also not be considered. With regard to the drag force, the Reynolds’ number of the ball during flight means that the ball will pass through the “drag crisis” associated with the transition from laminar to turbulent separation. In the trajectory calculations it was assumed, based on earlier work, that for a new ball this occurs between Reynolds numbers of 1.8 x10⁵and 2.2 x 10⁵, whilst for old balls, it occurs between 105and 1.4 x 10⁵. In both cases, the low Reynolds number drag coefficient was taken as 0.5 and the high Reynolds number coefficient as 0.3. For the trajectories calculated, the ball passed through the critical Reynolds number range both on the upward part of the trajectory, and on the downward leg.