Author: Chris Baker
A nurse’s grave (V)
In the records of headstone inscriptions for St. Michael’s churchyard in Lichfield, we find the following entry.
Sacred to the memory of Elizabeth Logan who died February 28th 1878. Having acted with Miss Nightingale in the Crimea on her return she followed the profession of sick nurse for which she was eminently qualified by her skill and experience. A strong sense of duty and great kindness of heart. No one who witnessed her self—denying exertions in aid of suffering humanity could ever forget them. Well done good and faithful servant. Thou hast been faithful over a few things, I will make thee ruler over many things. Enter thou into the joy of thy Lord.
The burial register tells us that she was 66 when she died and the register and lived on Dam St. In the 1861 census she is recorded as a nurse, lodging with a greengrocer and his wife on Market Street. She there identifies herself as “Mrs” and her birthplace is given as Glasgow. This leads me to conjecture that she was widowed before she went to Crimea, and probably had no children, although there are lots of other possibilities of course.
In the records of Miss Nightingale’s nurses she is noted as coming from Edinburgh and having been recommended by “Dr Simpson and others and committee of Nursing home” and was “one of the very best nurses, returned on the Ottawa, July 1856”. Florence Nightingale writes of her to her friend Lady Cranworth, from the Barrack hospital at Scutari in early July 1856.
My probable last letter to you is merely to say that Elizabeth Logan, nurse, whom I have sent home by the Ottawa is, on the whole, the one I consider the most respectable and sober, efficient, kind and good of all my nurses, the one I most hope not to lose sight of, the one I have the deepest regard for. She wishes for a private situation. If she comes to you for a character, I think you may be perfectly safe in recommending her. She is an excellent nurse.
Praise indeed from such as she. We read of Elizabeth briefly again in August 1856 when she wrote to Miss Nightingale saying her wages had not been settled (one presumes by the army), and in February 1857 when she wrote thanking her “for the Sultan’s gift and for her help in securing her present agreeable situation”. Would that we knew what the gift and her situation was!
And that is about as much as we know of her. The fact that she was probably a widow with her husband’s name makes her very difficult to trace through the census and baptism and marriage registers. Indeed Elizabeth Logan is not an uncommon name in Glasgow and Edinburgh around that period. So we have no details at all of her early life, or what she did when she returned from Crimea, other than that she finished up in Lichfield. In addition, sadly, her grave can no longer be positively identified, and there are a number of broken or very worn monuments in the region where a1984 survey by the Birmingham & Midland Society for Genealogy & Heraldry (Midland Ancestors) suggests it is to be found. But the presence of her grave in the churchyard does balance to some degree the many soldiers graves found there, including of those who fought in the Crimean War.
So to end with a plea – if any reader can provide any more information about her life, it would be hugely appreciated.

Ten of the best – a personal choice of Train Aerodynamics papers from 2022

Preamble
Since the publication of the book Train Aerodynamics – Fundamentals and Applications in 2019, I have published brief annual reviews of published papers in the field of train aerodynamics. Last year, in response to a plethora of poor quality papers, and the increasing use of sophisticated CFD techniques to tackle somewhat trivial problems, I changed the format slightly and presented brief comments on the ten “best” papers published in 2021. This seems to have been a popular format and has attracted almost 400 views in the last year, so I will repeat it this year. The concept of “best” is of course a wholly subjective one, and in reality, I have chosen the papers that follow for a number of reasons – their intrinsic quality, the fact that they address novel issues, or that the subject matter simply interests me. There are no doubt others I could have included. Nine out of the ten come from the Journal of Wind Engineering and Industrial Aerodynamics, which seems to have established its place as the leading journal in this field.
2022 seems to have been the “year of the wind fence” with a number of papers looking at the effectiveness of wind fences of different types and in different locations in protecting trains from cross winds, using both computational and experimental techniques. Although most of these have been competently carried out within their limitations, to choose just one for the following list would have been difficult, and I have thus chosen not to include any. The papers that are presented are arranged in a number of sections that correspond to Chapters in Train Aerodynamics – Fundamentals and Applications – pressure transients (2 papers), pantographs (1), trains in high winds (3), trains in tunnels (3) and emerging issues (1).
Finally, on a personal note, it has now been five years since I retired from the University of Birmingham, and I am very conscious that I am to some degree losing contact with the latest developments in the rail industry. Thus, whilst I will continue to keep an eye on train aerodynamics papers and may well comments on them individually in this blog, this will be my last annual review of the field. Unless of course I change my mind.
Pressure transients
600 km/h moving model rig for high-speed train aerodynamics
A maglev train with a speed of 600 km/h or higher can fill the speed gap between civil aircrafts and wheel rail trains to alleviate the contradiction between the existing transportation demand and actual transport capacity. However, the aerodynamic problems arising due to trains running at a higher speed threaten their safety and fuel efficiency. Therefore, we developed a newly moving model rig with a maximum speed of 680 km/h to evaluate aerodynamic performance of trains, thus determining the range of the aerodynamic design parameters. In the present work, a launch system with a mechanical efficiency of 68.1% was developed, and a structure of brake shoes with front and rear overlapping was designed to increase the friction. Additionally, a device to suppress the pressure disturbances generated by the compressed air, as well as a double track with the function of continuously adjusting the line spacing, were adopted. In repetitive experiments, the time histories of pressure curves for the same measuring point are in good agreement. Meanwhile, the moving model test and full-scale experimental result of maglev trains passing each other in open air are compared, with an error less than 4.6%, proving the repeatability and rationality of the proposed moving model.
This paper is mainly concerned with a description of a new 600 km/h moving model rig at Changsha in China. It is a remarkable piece of equipment, with sophisticated firing and braking systems. The development costs must have been significant. Having worked with moving model rigs in the past, I know that they can be prone to continual minor breakdown and breakages, particularly at high speeds, and it would be nice to know how reliable the new rig is, how many runs can be achieved in a day and so on. From the picture showing the maglev model that was used, there can already be seen to be signs of damage! The experimental results that are shown are not particularly novel, and one wonders if the equivalent results could not have been obtained on lower speed rigs and then scaled by (velocity)2. But nonetheless the authors (all seven of them) are to be congratulated on their efforts
Characteristics of transient pressure in lining cracks induced by high-speed trains.
Rapidly changing pressure waves in the tunnel can aggravate the crack propagation and cause concrete blocks to fall off, posing a threat to trains. Therefore, the influences of aerodynamic pressure on the lining cracks should be considered for high-speed railway tunnels in service. In this paper, the governing equations of air in cracks were derived based on the conservation of mass, momentum, and energy, which was verified by numerical simulations using the software FLUENT. The proposed model was used to analyze the influence of train speed and crack shape on the pressure distribution, peak value and pressure waveform in the crack. Subsequently, the crack tip damage was calculated. The results show that the abrupt change of pressure can amplify the pressure and damage of the crack tip, which can be aggravated by the increase of train speed and crack mouth width.
I found this a really interesting paper that addresses an issue that has not been considered in the past – the amplification of tunnel pressure transients within cracks in the concrete lining of tunnels leading to further damage and crack growth. It is a very neat combination of a theoretical approach informed by CFD work, that leads into a structural damage assessment. Clearly the authors have given considerable thought to the issue and have used the analytical and computational tools at their disposal wisely and intelligently.
Pantographs
The mean contact force between pantograph collectors and contact wire is affected by the aerodynamic uplift generated by aerodynamic forces acting on pantograph components. For a given pantograph geometry, orientation and working height, aerodynamic forces are strongly influenced by the position of the pantograph along the train roof, since an aerodynamic boundary layer grows along the train. This paper shows the experimental results of aerodynamic uplifts of full-scale pantographs located at four different positions along the roof of a high-speed train and adopts CFD simulations to examine the effect of the boundary layer velocity profile on the measured experimental forces. It is quantitatively demonstrated that the same pantograph located at different positions along the train roof can show relevant differences in the aerodynamic uplift, only due to the different flow characteristics. Moreover, a new simplified methodology is proposed to evaluate the aerodynamic uplifts at different positions of the pantograph along the train. Results of the proposed methodology are validated against full scale experimental results and full CFD simulations exploiting the complete model of the pantograph installed on the train roof.
This paper addresses an issue that has long been ignored – how the varying nature of the boundary layer on the train roof affects the aerodynamic performance of pantographs. In the past the aerodynamic coefficients have been assumed not to vary wherever the pantograph was placed in relation to the train nose. It represents a very elegant combination of large-scale wind tunnel experiments and CFD analysis, exploiting the strength of both methodologies, and leads to a straightforward and practical design methodology.
Trains in high winds
Wind tunnel test on the aerodynamic admittance of a rail vehicle in crosswinds
The aerodynamic admittance of a rail vehicle was investigated by wind tunnel test. Aerodynamic force was measured in the cases of three typical railway structures, including on the flat ground, above an embankment, and on a bridge, under two turbulent flow fields. First of all, three-component aerodynamic coefficients of the vehicle on each structure were obtained under uniform flow with respect to three wind attack angles and four wind direction angles. Secondly, the aerodynamic forces on the vehicle and the corresponding wind speed were evaluated to establish an aerodynamic admittance function of the vehicle. The aerodynamic admittance of the rail vehicle approximated a constant value in the low-frequency domain, but decreased with the reduced frequency increasing. The effects of the different reduced frequencies on the drag are greater than the lift admittance of the vehicle, while moment admittance stays steady-state. Finally, in order to reflect the unsteady characteristics of the buffeting force on the vehicle, the aerodynamic admittance functions of the vehicle were fitted to the expression of the frequency response function of a mass-spring-damping system, which was then verified. Furthermore, the effects of flat terrain and mountainous terrain were investigated, revealing that the influence of turbulence intensity on aerodynamic admittance is significant.
This experimental paper is the companion of a more theoretical one that was also published in 2022. This theoretical approach to describing aerodynamic admittances is based on work that I carried out in 2010, and it is good to see it much more fully investigated experimentally than myself and my co-workers were able to achieve at the time, with high quality aerodynamic admittance data being obtained for a range of turbulence simulations, and infrastructure and train geometries. There is more work to do however, in investigating just how important the concept of aerodynamic admittance actually is in train overturning calculations and how does its use affect the magnitude of the crosswind characteristics or CWCs (plots of accident wind speed against vehicle speed). The limited work myself and colleagues carried out on this a decade ago as we were developing a simple analytical framework for CWCs would suggest the effect is small, but it would be good to quantify this, and the results outlined in this paper would enable this to be done.
This paper studies the influence of different factors related to the structure-track-vehicle coupling system in the train’s stability against crosswinds, namely the bridge lateral behaviour, the track condition and the train type. With respect to the former, a parametrization of an existing long viaduct with high piers has been carried out to simulate different lateral flexibilities. The study concluded that the bridge’s lateral behaviour has a negligible impact in wind-induced derailments. Dynamic analyses considering four scenarios of track condition, ranging from ideal to poorer condition, but still within the limits stipulated by the codes, have also been carried out, leading to the conclusion that the track irregularities influence the running safety mainly on the higher train speed levels. This is due to the fact that the Nadal and Prud’homme indexes strongly depend on the wheel-rail lateral impacts, which become more pronounced for higher speeds and under poorer track conditions. Finally, four different trains have been adopted in the study to cover a wide range of vehicles. The results proved the importance of carefully considering the trains used in the analysis, since the train’s weight may vary significantly, leading to considerable different results in terms of vehicle’s stability against lateral winds.
This is the first of a two-part paper that considers the effect of various system characteristics on train behaviour in cross winds. This paper considers the safety issue, whilst its companion considers passenger comfort issues. The analysis uses simulations of wind fields, with a sophisticated MDOF train dynamic model and looks at the effect of bridge flexibility, track roughness and train type. With regard to the former, the effects on the calculated CWCs is small. Whilst this calculation is for a concrete viaduct, the results must cast considerable doubt on the analysis of a plethora of recent papers that have considered the movement of trains over bridge of different types, using highly complex methodology to describe bridge vibrations – was such complexity really required? The effect of track roughness on CWCS was shown to be somewhat more significant and is an issue that perhaps needs to be taken into account in any future work in my view. Finally, and intriguingly, the authors show that in some instances the Prud’homme derailment criterion is critical rather than the train stability criterion and suggest that this effect ought to be taken into account in the development of CWCS. This is a significant paper, and, with seven authors, shares the prize for most contributors in this selection. They are all to be applauded!
The tornado-induced unsteady crosswind responses of railway vehicles are investigated by using multibody dynamic simulations. Firstly, a tornado-induced aerodynamic force model is proposed by using the equivalent wind force method and the quasi-steady theory and validated by the experimental data. The Uetsu line railway accident caused by tornado winds on December 25, 2005 is then investigated by the proposed tornado-induced aerodynamic force model and the multi-body dynamic simulation. The predicted accident scenes show favorably agreement with those obtained from the accident survey when the maximum tangential velocity of tornado is around 41 m/s and the core radius is 30m. Finally, the dynamic amplification factor (DAF) for railway vehicles in tornado winds is systematically studied and it increases as the passing time decreases. It is found that the DAF can be effectively suppressed as the damping parameters increase while it decreases slightly as the natural frequency increases. A simple method to predict the DAF is also proposed based on simulation results.
This paper addresses an ongoing issue in the study of the effect of cross winds on trains – is the quasi-steady methodology adequate or are more complex models required – this time in the context of vary rapidly varying tornado loading. In the analysis the use of the discontinuous Rankine model (without radial inflow) and Burgers Rott model (which was used way outside its low Reynolds number region of applicability) somewhat limits the adequacy of the analysis, but probably not in a very significant way. The modelling is calibrated using a low speed moving model experiment. The use of the dynamic model enables significant details of the overturning process to be revealed, and shows that for rapid changes in flow velocity, there are significant overshoots in train forces from the quasi-steady values. I do wonder however, in view of the fact that tornado wind field modelling is a very uncertain procedure (and likely to remain as such) whether the complexity of the use of dynamic models is actually justified. The jury is still out on this issue I think.
Trains in tunnels
Micro-pressure wave radiation from tunnel portals in deep cuttings
The reflection and radiation of steep-fronted wavefronts at a tunnel exit to a deep cutting is studied and contrasted with the more usual case of radiation from over-ground portals. A well-known difference between radiation in odd and even dimensions is shown to have a significant influence on reflected wavefronts, notably causing increased distortion that complicates analyses, but that can have practical advantages when rapid changes are undesirable. Likewise, micro-pressure waves radiating from the portal into a cutting are shown to exhibit strong dispersion that does not occur in the corresponding radiation into an open terrain. In the latter case, formulae that represent the behaviour of monopoles and dipoles are commonly used to estimate conditions beyond tunnel portals, but no such simple formula exists (or is even possible) for cylindrical radiation that is characteristic of MPWs in cuttings. An important outcome of the paper is the development of an approximate relationship that predicts the maximum amplitudes of these MPWs with an accuracy that should be acceptable in engineering design, at least for initial purposes. The formula shows that peak pressure amplitudes decay much more slowly than those from an overground portal, namely varying approximately as r 0.5 compared with r 1, where r denotes the distance from the portal.
This paper describes a thoughtful, analytical study that addresses the effects of deep cuttings at the exit of tunnels on the reflected and transmitted pressure waves. It is shown that the reflected waves take longer to develop and are more spread out than with a tunnel outlet on level ground and that the radiating pressure wave (the MPVs) decay much less rapidly. The paper gets to the heart of the basic assumptions underlying tunnel pressure wave analysis and brings to light issues that users of commercial software need to be very aware of.
Transient pressure variations on train and platform screen door (PSD) surfaces when a high-speed train passed through an underground station and adjoining tunnel were studied using a moving model test device based on the eight-car formation train model. The propagation characteristics of the pressure wave that was induced when the train passed through the station and tunnel at a high speed were discussed, and the effects of the train speed and station ventilation shaft position on the surface pressure distribution of the train and PSDs were analyzed and compared. The results showed that the pressure fluctuation law is different for the train and PSD surfaces, and the peak pressure increases significantly with an increase in the train speed. Ventilation shafts changed the pressure waveform on the surface of the train and PSDs and greatly reduced the peak pressure. A single shaft at the rear end of the platform and a double shaft at the station had the most significant effect on relieving transient pressure on the surface of the train and PSDs, respectively. Compared with the case with no shaft, these two shafts reduced the maximum amplitude pressure variation of the train and PSD surfaces by 46.3% and 67.4%, respectively.
This paper describes a nicely set up and carried out series of experiments using a moving model rig. The situation that is considered (an underground station in a high-speed tunnel network) is quite generic and could form a useful test case for airflow calculation methods. The effect of air shafts on reducing pressures is very clear. It would have been nice to see more variations of air shaft geometry in the experimental programme, but the authors probably felt they had more than enough to do.
The air compression of a high-speed train entering a tunnel results in micro-pressure waves (MPWs), which can cause environmental problems. To mitigate MPWs, tunnel hoods with discrete windows are installed at the tunnel entrances. By properly adjusting the window conditions, the efficiency of the tunnel hood in mitigating MPWs can be enhanced. Per Japanese convention, window conditions are optimized by changing the opening/closing pattern in the longitudinal direction (pattern optimization). The optimization pattern of the windows is fundamentally different if there is a change in the train speed, train nose length, the relative position between the train and the windows, or the train nose shape. Therefore, for extremely long tunnel hoods, the optimal state of the windows is almost impossible to detect numerically or experimentally using pattern optimization. In this study, we realized a rapid and simple optimization of the windows of the tunnel hood (i.e., area optimization) for mitigation of MPWs by field measurements. The result demonstrated that the area optimization considerably helps in mitigating the MPWs, despite the simplicity of the procedures.
To reduce MPW magnitudes, the initial gradient of the pressure waves caused by train entry into the tunnel need to be minimised (since these steepen along the tunnel, with steeper waves producing stronger radiated MPWs at the outlet). One way of doing this is to design a variable area entrance hood, with openings along the side so that the pressure wave builds up gradually. The optimisation of these openings has in the past been somewhat hit and miss, and it difficult to know what is the optimal configuration. This paper describes a simple optimization methodology and presents a series of quite ambitious full-scale experiments to validate this methodology. The final result is a very simple but effective arrangement of openings which represents the best that can be achieved.
Emerging issues
Due to the density of people in the cabins of high-speed trains, and the development of the transportation network, respiratory diseases are easily transmitted and spread to various cities. In the context of the epidemic, studying the diffusion characteristics of respiratory pollutants in the cabin and the distribution of passengers is of great significance to the protection of the health of passengers. Based on the theory of computational fluid dynamics (CFD), a high-speed train cabin model with a complete air supply duct is established. For both summer and winter conditions, the characteristics of the flow field and temperature field in the cabin, under full load capacity, and the diffusion characteristics of respiratory pollutants under half load capacity are studied. Taking COVID-19 as an example, the probability of passengers being infected was evaluated. Furthermore, research on the layout of this type of cabin was carried out. The results show that it is not favorable to exhaust air at both ends, as this is likely to cause large-area diffusion of pollutants. The air barrier formed in the aisle can assist the ventilation system, which can prevent pollutants from spreading from one side to the other. Along the length of the train, the respiratory pollutants of passengers almost always spread only forward or backward. Moreover, when the distance between passengers and the infector exceeds one row, the probability of being infected does not decrease significantly. In order to reduce the probability of cross infection, and take into account the passenger efficiency of the railway, passengers in the same row should be separated from each other, and it is best to ride on both sides of the aisle. In the same column, passengers only need to be separated by one row, and it is not recommended to use the middle of the carriage. The number of passengers in the front and back half of the cabin should also be roughly the same.
This is an interesting and important paper, arising of course out of the recent pandemic. Through the use of reasonably straightforward CFD methodology, the spread of pathogen from any point within a railway carriage to any other point can be calculated, and from this the probability of infection can be ascertained. This methodology may have widespread future use and can be used to inform passenger loading configurations with to minimise infection probabilities. The calculations were restricted to likely infection from an infected passenger in a small number of locations. There is no reason why the number of locations should not equal the number of possible passenger conditions and a matrix produced on of infection in seat i due to an infected individual in seat j, which would enable a fuller picture of infection rates to be developed.

Cross Wind Characteristics – a mathematical curiosity
Readers of this blog will know that one of the subjects that I have worked on over the last 40+ years has been the effect of cross winds on trains. By this time, one would have thought that I should have plumbed the depths of the topic, but it still has the ability to surprise. In this short (and very nerdy) post I want to describe a mathematical curiosity associated with this subject that I have recently become aware of.

Box 1, CWC Calculation methodology
In the book “Train Aerodynamics – fundamentals and applications” I set out a simple methodology for calculating Cross Wind Characteristics (CWCa) – essentially plots of overturing wind speed against train speed. This is based on a simple three mass model and the equations are set out in Box 1 above – equation (A) for the low yaw angle range, and equation (B) for the high yaw angle range. I won’t describe this in further detail here – the book only costs £132 on Amazon, so any interested readers can find a fuller description there and provide some minimal royalties to myself and the other authors.
Recently I have had occasion, as part of a consultancy project, to develop simple spreadsheet to enable CWCs to be calculated for a range of different types of rail vehicle. The method I chose was to solve equation (A) for low yaw angles below the critical yaw angle and equation (B) for high yaw angles above the critical angle, using the Newton Raphson iterative method. These equations give an explicit solution for the overturning wind speed at a train speed of zero. The value of train speed is then increased in small increments up to the vehicle maximum operating speed, with the first estimate in the iteration at any one wind speed being the converged value of wind speed from the previous calculation with a slightly lower train speed. Convergence is usually very rapid, usually just one or two iterations.

Figure 1 Calculated CWCs for n1=1.5, n2=0 for wind directions up to 90 degrees

Figure 2 Calculated CWCs for for n1=1.5, n2=0 for wind directions above 90 degrees

Figure 3 Calculated CWCs for for n1=1.5, n2=-0.5 for wind directions above 120 degrees
The methodology in general worked well, and some of the results for different wind directions relative to the train direction of travel are shown in Figures 1 and 2 (for lee rail rolling moment coefficients at 30 and 90 degrees of 2.2 and 3.5 respectively and parameters n1 and n2 of 1.5 and 0.0, i.e. a steadily increasing rolling moment coefficient up to the critical yaw angle, and a constant value above that angle). The two yaw angle ranges can be clearly seen, with the lower yaw angle range at the higher train speeds, and the higher yaw angle range at the lower train speeds. For the train aerodynamic characteristics shown here, the calculations are very stable up to a wind direction of 120 degrees. However, if the calculation is carried out for higher wind directions, then something odd happens and the iteration becomes unstable as can be seen for the 135 and 150 degree cases in figure 2. This effect is even more severe for different rolling moment characteristics. Figure 3 shows the CWCs for the same rolling moment coefficients and value of n1, but with a value of n2=-0.5 and thus with a peak at the critical yaw angle, which is typical of high-speed trains. Here we can see major instabilities for wind directions above 120 degrees. I was very puzzled as to why this was the case. Whilst in practical terms this is of no significance, as the overturning wind speeds for such wind directions are high and not close to the minimum critical value at any one vehicle speed, but nonetheless it would still be good to understand what was going on.
After playing around with the equations for a while, I found the best way to understand this was to regard equations (A) and (B) as quadratic equations in train speed and solve for train speed for a range of values of overturning wind speed. This is the wrong way round of course, as the vehicle speed is really the independent variable that can be specified, and the wind speed is the dependent variable that needs to be calculated but solving the equations in this way proved to be illustrative.
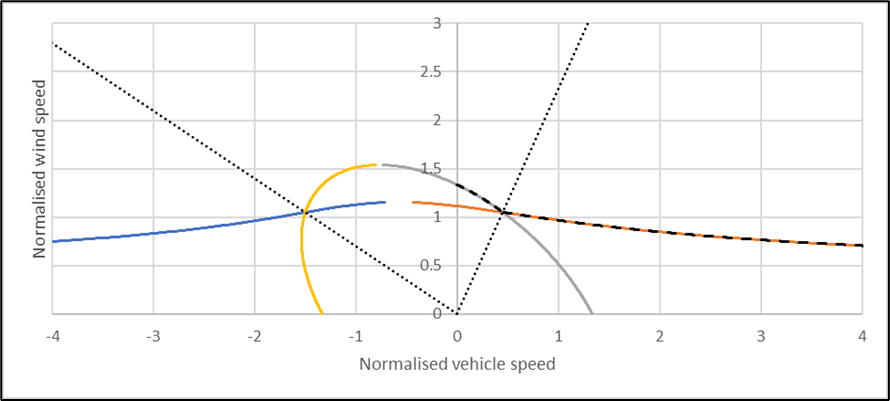
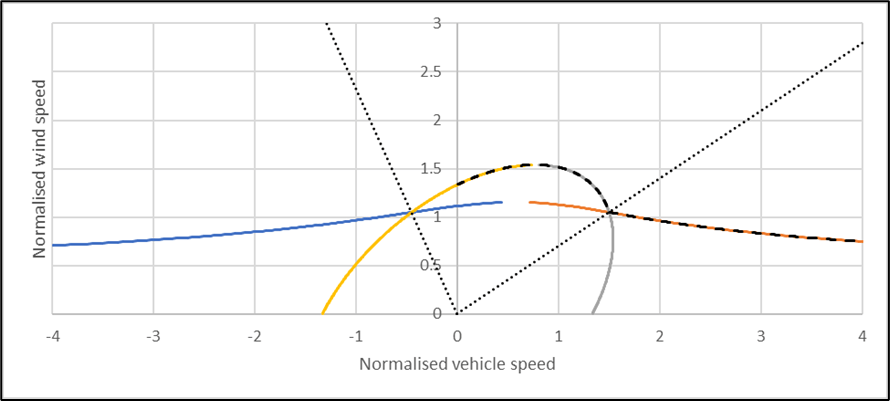
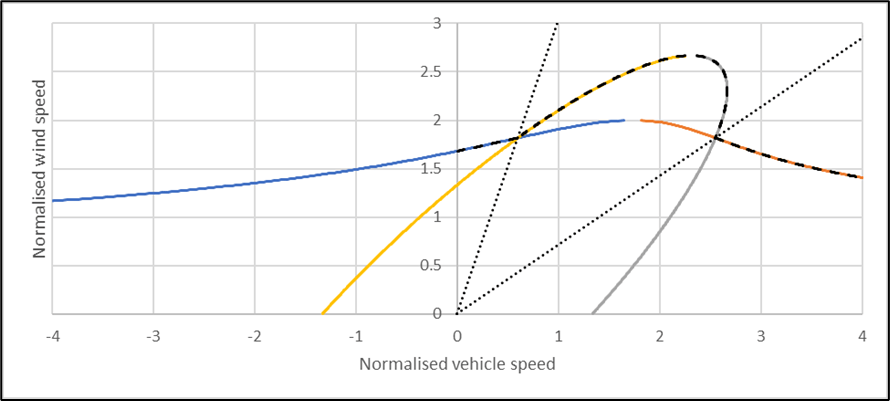
As the equations are quadratics, there are two solutions for train speed for each value of wind speed for each equation, and regions of the vehicle speed / wind speed plane where no solutions exist. There are thus four distinct solutions to the equations, two for the low yaw angle range and two for the high yaw angle range. These are shown for a range of different wind directions in Figure 4 for the same case as in figures 1 and 2. Here the solutions are shown for both positive and negative train speeds. The critical yaw angle condition is indicated by the short-dotted lines – between the lines the high yaw angle curves will form the CWC and outside them the CWC will be formed from the low yaw angle curves. The calculated CWCs (in the positive velocity quadrant) are shown by the long-dotted line.

a) Wind direction = 30 degrees

b) Wind direction = 60 degrees

c) Wind direction = 90 degrees

d) Wind direction = 120 degrees

e) Wind direction = 150 degrees
Figure 4 Complete solutions of equations A and B for for n1=1.5, n2=0
Consider first the 90 degrees yaw angle case (Figure 4c). Here the solutions are symmetric about the wind speed axis, and the CWC simply takes the positive high yaw angle solution at low vehicle speeds, and the low yaw angle solution at higher vehicle speeds. As the wind direction moves away from this case, the solutions become skewed, although there is still a degree of symmetry about the 90 degreecase, with the 30 degrees case being the image of the 150 degrees case, and the 60 degrees case being the mirror image of the 120 degrees case.
For the 30 degree case the CWC is formed entirely from a solution to a low yaw angle equation. At 60 and 90 degrees the CWC is formed from one low yaw angle solution, and one high yaw angle solution. At 120 degrees, the CWC consists of one low yaw angle solution and two high yaw angle solutions, whilst at 150 degrees the CWC consists of two low yaw angle and two high yaw angle solutions. There is thus considerable complexity here that is not fully revealed by simply considering the direct calculation of the CWC.
But coming back to the reason for this study, a consideration of the 150 degrees case shows the reason for the instabilities in figures 2 and 3. One of the high yaw angle curves that comprise the CWC doubles back on itself – ie there are two values of normalized wind speed that have the same values of train speed. The iterative method is thus jumping from one value to another and not converging,
As I said, this is not a practical issue as the overturning wind speeds in the wind direction range above 120 degrees are significantly higher than the minimum values which tend to occur around a wind direction of 80 degrees. The iterative calculation method for wind speed at a particular vehicle speed should only be used with caution in this range, and if values are required, the rather more cumbersome solutions for vehicle speed at a particular value of wind speed should be used. In personal terms the graphs of the solutions of figure 4 are rather attractive and their symmetry and form satisfying, and it was fun trying to sort out the reason for the instabilities. Being retired one has the leisure for this sort of thing! Perhaps however it is no bad thing to appreciate a little more the complexities behind what is intended to be a simple calculation method for CWCs.
The Pensnett Canal and Pensnett Railway


Preamble
In canal histories, the Pensnett Canal is usually little more than a footnote – a short, one and a half mile private canal, often referred to by its owner’s name as Lord Ward’s canal, extending from the south end of Dudley tunnel with no locks or major engineering structures, to the Wallows to the south west, serving a number of iron works and mines on the way, from 1840 when it was built, through to the 1940s when commercial traffic ceased. What little there is to say about it is summarized in the definitive work of Hadfield (1), The Pensnett Railway by contrast, figures rather more prominently in railway histories, and indeed there are at least two books devoted to it (2), (3). Its origins can be traced back to the Kingswinford Railway of 1829, of Agenoria fame, with which it later merged, but it came into existence in its own right in 1843, again centred on the Wallows area, and eventually spread out across the southern Black Country, with more than 30 miles of railway, serving the mines and local industry in some form or other though to the 1960s.
In canal histories, one finds that the Pensnett Railway is rarely mentioned in any description of the Pensnett Canal, and similarly railway histories do not include the Pensnett Canal to any extent in the description of the Pensnett Railway. The history of both undertakings has thus been neatly compartmentalized. In this post, I will argue that this compartmentalization actually obscures something of importance – that both Canal and Railway have their origins in the same industrial and commercial needs and that the Pensnett Canal was conceived in part as a link in a much wider canal network that was never built to meet these needs. These needs were actually met in the construction of the Pensnett Railway, and indeed the initial construction was to a significant degree based on the abortive canal network proposals. Thus, the histories of the two undertakings need to be considered together, and in what follows we will attempt to do this in broadly chronological order.
The Kingswinford Railway

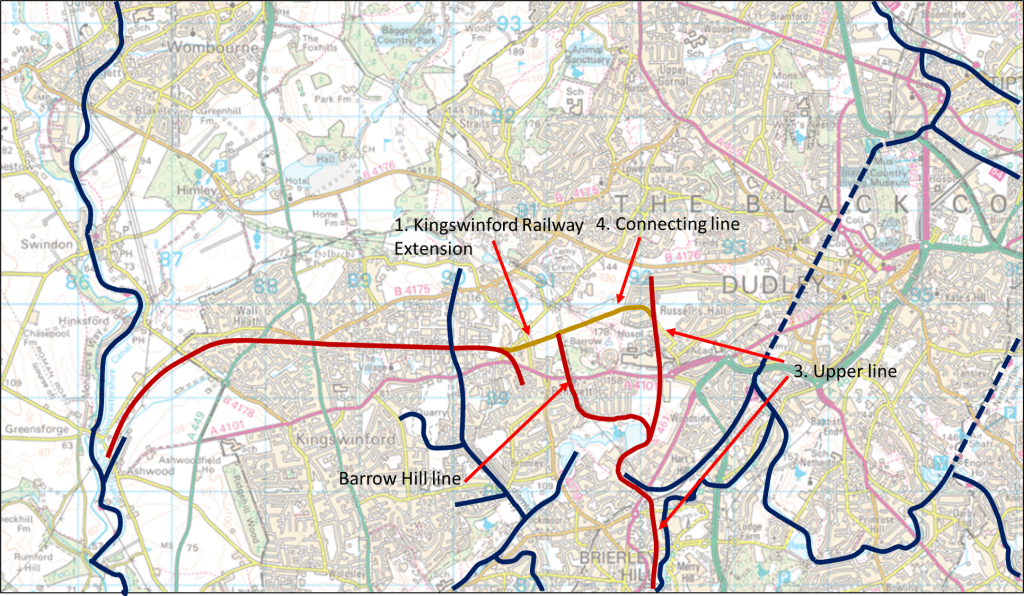
Figure 1 Canals and railways in the Kingswinford area in the 1820s (dark blue lines indicate canals, dark brown lines indicate railways)
In the early / mid 1820s, the area to the south of Dudley, mostly in the large parish of Kingswinford, was undergoing significant industrial development (figure 1). Coal and iron extraction was already underway in the south of the area around Brierley Hill and Brockmoor and a number of iron works were in operation. The transport needs of these industries were met by the three canals that existed in the area at the time – the Staffordshire and Worcestershire Canal to the west, which offered an outlet for industrial products to the northern cities (via the Trent and Mersey Canal) and to the south and west (via the Severn). The Stourbridge canal to the south which allowed coal and iron products to access the Staffordshire and Worcestershire at Stourton, and via the Dudley Canal and the Dudley and Lapal tunnels gave access to the central Black Country area and the route to London.
However, as the decade progressed, coal and ironstone mining and iron manufacture pushed northward – to the mines and iron works of Corbyn’s Hall, owned by the Gibbons brothers (4), and beyond that to what would be the vast iron works of Bradley and Co in Shut End owned by James Foster (5). The Earl of Dudley’s Estate, which was the major landowner in the area was also beginning to develop significant mining activities in the Barrow Hill and Old Park areas. These concerns needed a reliable means of transportation for their products around the country. Discussions were held with the Stourbridge company to consider a branch into the area, but these came to nothing. The Dudley Estate, then took the matter into its own hands and conducted what was to become known as the Kingswinford Railway, which connected the Corbyn’s Hall and Shut End areas with the Staffordshire and Worcestershire canal at Ashwood Basin (figure 1). Most of the land was owned by either the Dudley Estate or by James Foster with just a small area owned the other major landowner in the area, John Hodgetts Hodgetts-Foley of Prestwood, with whom a lease agreement was concluded. It consisted of a 1 in 28 incline of 500 yards in length from Ashwood Basin which was followed by a largely level stretch of two miles, before another (Foster’s) incline that led to the Corbyn’s Hall area. A branch incline led into the Bradley and Co ironworks. The inclines were horse drawn, but the central section was operated by the steam engine Agenoria, about which much has been written (6). The line thus met the immediate needs and provided an outlet for the produce from the area, and also provided a steady toll income for the Dudley Estate.
Canal developments

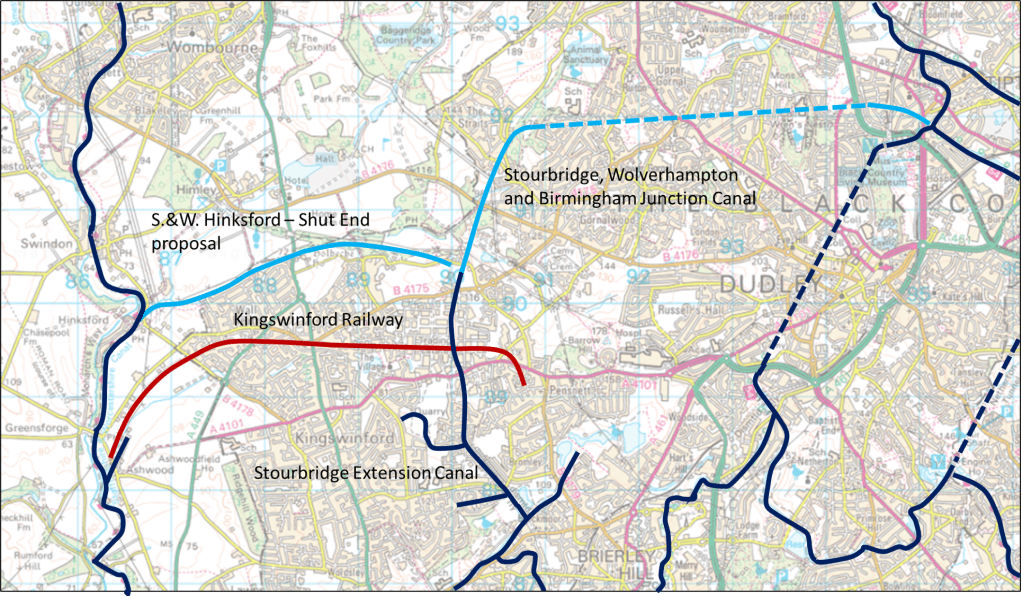
Figure 2 Canals and railways in the Kingswinford area in mid / late 1830s (dark blue lines indicate canals, that were constructed, light blue lines indicate canals that never passed beyond the proposal stage, dark brown lines indicate railways)
Whilst the Kingswinford Railway addressed some of the issues, others remained. Perhaps the most significant of these was to find an outlet for both coal and iron products to the north and east. In the short term this issue was solved in the mid-1830s by the construction of quite lengthy tramways to the Stourbridge Canal Feeder branch from the Corbyn’s Hall area and from the Dudley Estate mines in the Barrow Hill area and from there products could be carried back to the main line of the Stourbridge and Dudley canals and the Dudley tunnel (7). However, such transshipment was expensive and time consuming and some better form of carriage was required. Thus in 1836 a new company, formed by some of the Stourbridge Canal shareholders, put forward for parliamentary approval a proposal for a canal from the feeder branch at Brockmoor (at its summit level of 356 feet above sea level) to Corbyn’s Hall and Shut End, then onward to Straits Green and Sedgley with a flight of locks rising to the Wolverhampton level of 473 feet above sea level, and then through a one mile tunnel to the Birmingham Canal at Bloomfield (figure 2) (8). This canal – the Stourbridge, Wolverhampton and Birmingham Junction – would thus give access for the products of the Shut End and Cotbyn’s Hall area to both north and south without transshipment from tramways. It was opposed by both the Staffordshire and Worcestershire Company and the Dudley company as it potentially offered a bypass from the south that avoided the Wolverhampton locks on the Birmingham canal at the junction with the former, and also offered a more direct alternative to the Dudley Canal and tunnel. The former put forward their own proposal for a branch from Hinksford to Gornal Wood near Oak Farm, with 13 locks rising 104 feet, which was supported by the Dudley Estate (9*). The conjectured route (following the course of the Holbeche brook) is also shown in figure 2. The projected rise would have taken it to a height of around 320 feet, somewhat below the level of the Stourbridge, Wolverhampton and Birmingham Junction Canal. However, before parliamentary arguments could begin, it became clear that the Stourbridge Company could not raise the necessary finance, and the plan was curtailed and became a two-mile level canal from the Stourbridge to Shut End, with branches to Standhills and Bromley (the latter unauthorized) where it terminated. It was renamed the Stourbridge Extension Canal, and opened in 1840. As such it still served a useful purpose in allowing goods to be moved more speedily onto the Stourbridge Canal and then onwards, but it did not help with the issue of longer distance transport to the central Black Country and beyond.
Plots and intrigues

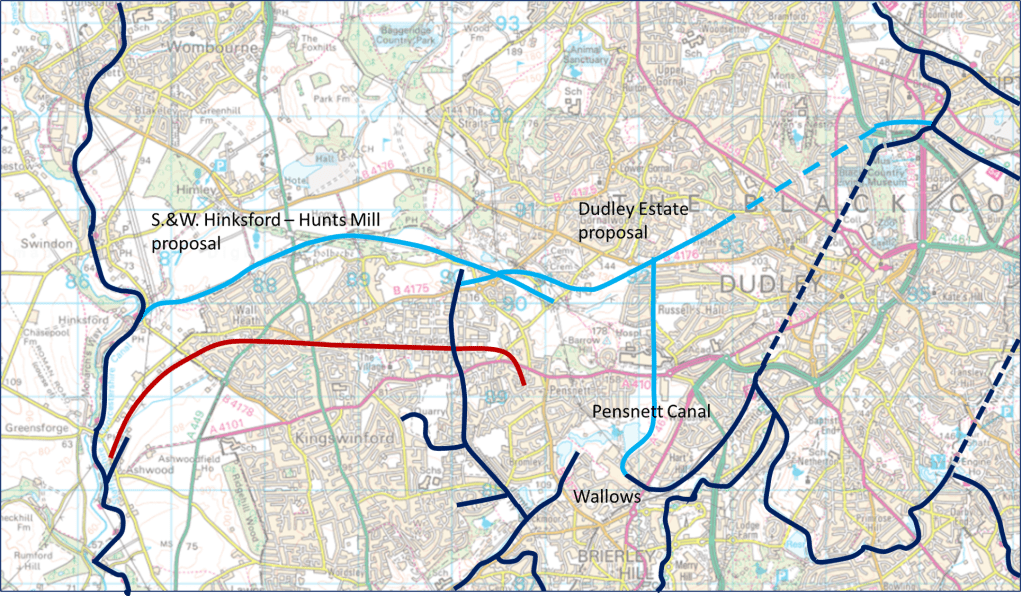
Figure 3 Canals and railways in the Kingswinford area in 1839/40 (dark blue lines indicate canals, that were constructed, light blue lines indicate canals that never passed beyond the proposal stage, dark brown lines indicate railways)
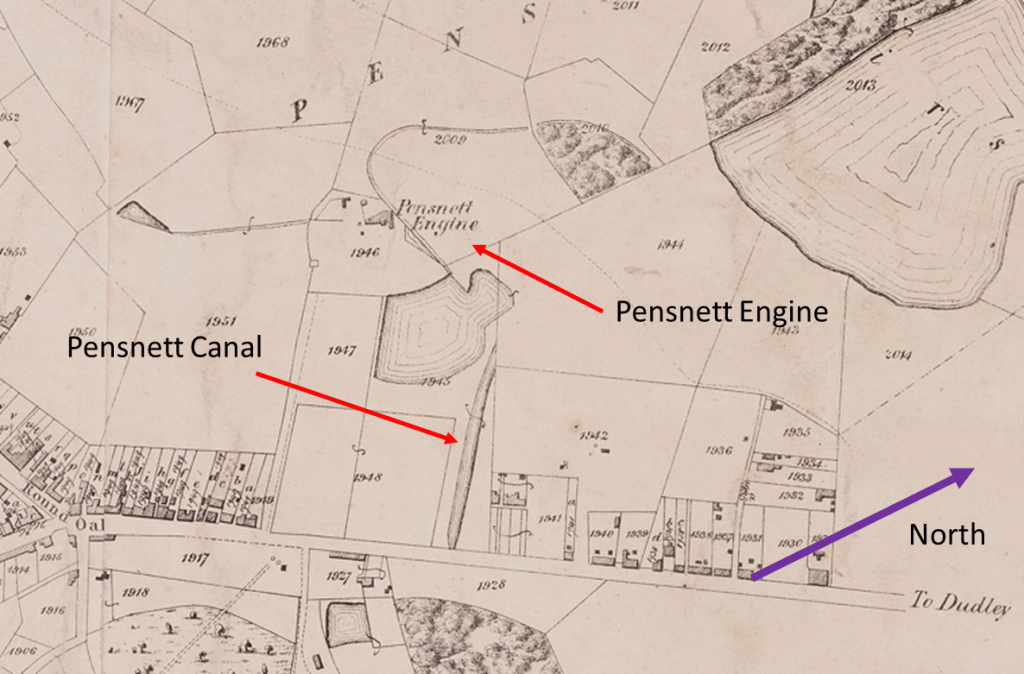
Whilst the Extension Cana was in its final stages of construction in 1839, two events occurred. The first was the building of the Pensnett Canal from the Wallows towards the southern portal of Dudley tunnel by the Dudley Estate. There were developing mining activities in the Wallows area, so of itself this was a justifiable step (figure 3). As it was on land owned by the Estate, no parliamentary approval was required. It was completed and in use by 1840. The canal was built on the Wolverhampton level of 473 feet. The start of its construction is captured on the Kingswinford Tithe Map of 1839 shown in figure 4 (10). The channel at what was to become the south west end of the canal can be seen, together with the “Pensnett Engine” that was used to dewater mines in the area – and which may have been intended to be the water supply to the canal.

Figure 4. Extract from the Kingswinford Tithe Map of 1839 showing the early stage of construction of the Pensnett Canal and the Pensnett Engine at the Wallows. Note the direction of north.
Also in 1839, the Staffordshire and Worcestershire canal company revived their proposal of 1836 for a branch from Hinksford but extending somewhat further and ending near Hunts Mill (11*). This would have required more locks than the earlier proposal, to bring it to that point, which is around 350 feet above sea level – very close to the Stourbridge Extension Canal level. If it again followed the line of the Holbeche Brook, it would thus pass a little way to the north of the Extension Canal. The Stourbridge and Stourbridge Extension companies were alarmed by this, as they could see that potentially this branch could link with the Pensnett Canal in direct competition to their route. It would seem that meetings were held, and the proposals were withdrawn.
However, it was soon to be shown that the worries of the Stourbridge and Stourbridge Extension companies were quite justified. In 1840 a proposal was put forward by the Dudley Estate for a canal that joined with the Extension Canal at Shut End at the Stourbridge level of 353 feet, then rose through 19 locks to the Wolverhampton level on the Old Park area, where it was joined by an extended Pensnett Canal (12), (13). It then passed through a tunnel before joining the Birmingham Canal at Tipton near the northern portal of the Dudley Tunnel. This would have served the Dudley Estates mining developments in the Wallows and Old Park area and would also have served the Estate mines in the Barrow Hill area. Moreover, a direct connection with the proposed Staffordshire and Worcestershire branch would have been straightforward near the junction with the Stourbridge Extension Canal as they were on the same level. But, as Hadfield (1) remarks, the time was past, and the newer more efficient railways were already beginning to make inroads into the area, and the scheme was never progressed. Had it done so, the canal map of the south western black country would have been very difficult.
The Pensnett Railway

Figure 5. Pensnett Railway proposals of 1843 (dark blue lines indicate canals, dark brown lines indicate railways that were constructed, light brown line indicate railways that never passed beyond the proposal stage)
Although the Stourbridge Extension Canal and Pensnett Canal were completed and came into use, the need for rapid transport of the produce of the area to the Black Country, Birmingham and beyond remained. This was to become less pressing however, as local needs for coal and ironstone were increasing at the same time as the output from the traditional sources in the Brierley Hill area were decreasing. In particular the Level New Furnaces provided a ready market for the products of the Dudley Estate mines in the Barrow Hill area. This led to the Trustees of the Dudley Estate commissioning F. P. Mackelcan to develop schemes for railways in the area (2). He proposed the following lines (figure 5)
- An extension from the end of the Kingswinford Railway and running to the Dudley Estate mines at Barrow Hill and Old Park via a one in seventeen incline.
- A branch from this line that went up the one in twenty-five Barrow Hill incline, passed underneath the Dudley – Kingswinford turnpike road and skirted the Fens pool to join the third line below.
- The upper line from the mines of the Old Park area, underneath the Turnpike Road, around the Fens Poll to the Wallows, and then to the Level New Furnaces and the top of the nine locks.
- A line uniting the end of the upper line and the end of the extension.
It is striking how much these proposals were influenced by the earlier canal proposals. Firstly, the extension of the Kingswinford Railway would have served the same function as the canal branch from Hinksford proposed in 1836 and 1839, connecting the mines in the Barrow Hill area with the Staffordshire and Worcestershire canal. This proposal was not acted upon, as there were worries about the long-term stability of the existing Foster’s incline. Secondly the northern section of the upper line to Old Park (known as the “High lines”) follows closely the line of the extension to the Pensnett Canal proposed in 1840. Thirdly the line connecting the extension to the upper line, which again was not built, would have followed the route of the 1840 canal proposals. Finally it should be noted that the designs were very much based on canal technologies – level stretches of track connected by inclined planes, and there were canal transshipment wharves at the Wallows and at the end of the Delph branch. Whilst the Pensnett Railway was to develop very much further in the area in a more conventional railway manner over the coming decades, its genesis in the various canal schemes of the late 1830s and early 1840s seems to be clear. The Pensnett Canal and the Pensnett Railway developed because of the same industrial needs and are best considered as different solutions to the same transport issues. Their history is inextricably tied together.
References
1. Hadfield C “The Canals of the West Midlands”, David and Charles, 3rd Edition, 1985
2. Gale W. K. V. “A history of the Pensnett Railway”, Goose and Son, 1975
3. Williams N. “The Earl of Dudley’s Railway”, The History Press, 2014
4. Grace’s Guide, https://www.gracesguide.co.uk/Benjamin_Gibbons_(1783-1873)m Accessed September 2022
5 Grace’s Guide, https://www.gracesguide.co.uk/James_Foster, Accessed September 2022
6. Grace’s Guide, https://www.gracesguide.co.uk/Foster,_Rastrick_and_Co:_Agenoria , Accessed September 2022
7. Baker C J, “Kingswinford Manor and Parish”, https://profchrisbaker.com/kingswinford-manor-and-parish-new/ , Accessed September 2022
8. Dudley Archives “Plan of Stourbridge, Wolverhampton & Birmingham Junction Canal”, DE/6/12/3/26, 1836
9*. Staffordshire Records Office “Plan, book or reference and section of an intended navigable cut or canal called the Staffordshire and Worcestershire Canal at or near Hinksford in the Parish of Kingswinford, County of Stafford”, Q/RUm/86, 1836
10. Staffordshire Records Office “Kingswinford Tithe Map”, Staffordshire Past Track, 1839
11*. Staffordshire Records Office “Plan, book of reference and section of intended cut or canal called the Staffordshire and Worcestershire Canal Navigation at or near Hinksford, in the Parish of Kingswinford, County of Stafford, to a certain close of arable land called the Plain Piece near Hunts Mill”, Q/RUm/121, 1839
12. Dudley Archives, “Sections of Intended Canals between Tipton Green and Shut End and between Dudley and Coseley”, DE/6/12/3/37, 1840
13. Dudley Archives, “Plan of Railways, Canals and Roads between the Black Country and Birmingham”, DE/6/12/3/44, 1841
* At the time of writing (September 2022) I have not consulted these items in full, as Staffordshire Records Office is closed for refurbishment. I will do so as soon as I am able and make any necessary changes to this post. However, what I have written is consistent with the catalogue contents, and what is presented in (1).
A view from St. Michael’s church in Lichfield in 1840

Recently, whilst searching for some lost material in the choir vestry at St. Michael’s, I came across a framed version of the picture shown above, which is one that I have not seen before. It shows a view from the north side off the church looking out over the city in 1840. In some ways it is very familiar, with the cathedral in the background, and in the middle distance, towards the left of centre, we can see St Mary’s, but without its spire that wasn’t added until the rebuilding of the 1850s and 1860s. In front of St. Mary’s, we can see the back of houses that were on Greenhill, and housing in the area that we know as Deanscroft but was more usually referred to at that time as Dean’s Croft. Indeed parts of this were still owned by the Chapter of the Cathedral in the 1840s. The Greenhill / Church St / Dean’s Croft area was quite densely populated at that time. Now that area is largely taken by the old school buildings (built in stages in the second half of the nineteenth century). The position of the cathedral and the houses enables the position of the artist to be determined fairly accurately – see the map below.

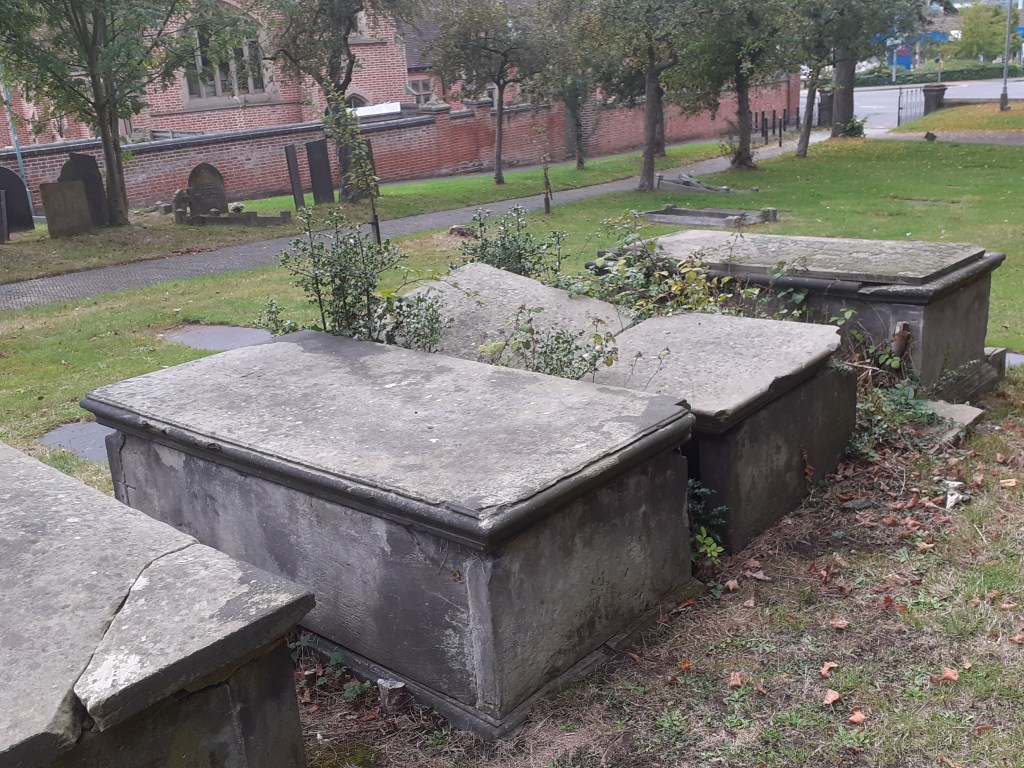
But it is in the foreground that we see the major changes when comparing this picture with what we see now, with many more graves and monuments visible than is now the case. But here all is not all that it seems. Firstly, it is puzzling that the avenue of trees that leads from the church door to the north gate is not shown. This was planted as an avenue of elms in the 1750s and should have been visible. Perhaps they obscured the view, and the artist, as was his or her prerogative, thought it best to omit them. Secondly it is difficult to reconcile the grave locations in the picture with those currently visible. A photograph that shows roughly the same view is shown below. Whilst many of the headstones were laid flat in the re-ordering of the churchyard in the 1960s, the chest tombs were generally left in position, and these have usually survived to the present day.

What remains in today’s view is the large Emery chest tomb to the left, and the rather dilapidated row of chest tombs to the right. The details of the graves in the picture from 1840 are a little different in the photographs with different grave styles and only three graves in the row to the right, again suggesting the use of “artistic license” in the drawing. Some of the grave details are reminiscent of those on other chest tombs in the graveyard, so the artist might have been trying to capture a range of details not completely in the field of view. The ground level also appears to have changed, with a build up of the ground around the base of the tombs so that they appear lower than they did originally. This is due to many decades of grass growth and mowing, leading to a steady increase in height of the ground surface.
Returning to the graves themselves, the inscription on the Emery tomb was recorded in the 1980s as follows, although much of this is no longer readable.
Sacred to the memory of WILLIAM EMERY died December 9th 1767 aged .9 years. And of MARY his wife who died… Also of ELIZABETH and ANN daughters of WILLIAM and MARY EMERY. ELIZABETH died January 27th 1773 aged 16. ANN died…… WILLIAM who died March 12th l…„and ANN EMERY his wife died July 8th 1825 aged 66. Also JOHN son of RICHARD and ANN EMERY died January 18th 1853 aged 46. And of RICHARD EMERY who died February 23rd 1826 aged 72 also ANNE wife of above died December 17th 1863 aged 82.
Those to the right are largely of the Harrison family. Again in the 1980s the inscriptions were transcribed as follows.
Rev. JOHN HARRISON son of THOS. and FRANS. HARRISON died January 22nd 1793 aged 39. THOMAS HARRISON son of THOS. qnd FRANS. HARRISON died December 31st 1807 aged 48
Here lieth the body of ANN the wife of SAMUEL HARRISON who departed this life Jany 1st 1785 aged 48. Also near this place lies the body of JESSE DEE (brother to the said ANN HARRISON) who died June 1st 1785 aged 39
To the memory of SAMUEL HARRISON who died April 2nd 1798 aged 62.
In memory of Sarah Harrison who departed this life July 28th 1835 aged 72 years
These tombs have seen better days as can be seen from the close up picture below.

Of course, what is also missing from the modern photograph is the sheep – the nineteenth century version of the council grass mowing machine – and the rather elegantly dressed family who are walking down the path from church. The husband and wife are very clear, but their two young children less so. In the original picture there is a similarly dressed gentleman sitting on a chest tomb that is no longer identifiable, apparently studying his laptop, although this is probably not the correct interpretation!
John Louis Petit and the Black Country
This article first appeared in the Summer 2022 edition of the Blackcountryman. Unfortunately a number of figures were omitted and some other figure captions were incorrect. The electronic version of that edition on the web site contains a correction page, and the full corrected article is given here for convenience.
Preamble
The “Gothic Revival” In church architecture in the mid-nineteenth century was largely driven by the Ecclesiological Society, formed in 1839, the members of which were insistent that the only proper design of church building was the decorated gothic style of the middle ages. Proponents of this style included Augustus Pugin and Gilbert Scott and many of the Anglican churches that were built in the second half of the nineteenth century reflected these principles. There were however, a small but vociferous opposition who advocated careful preservation of medieval buildings and that new work should build on and complement earlier styles. The arguments between the factions reached a quite astonishing level of intensity and vitriol. For example, the rather unpretentious chancel of St. Michael’s church in Lichfield, which will be referred to in what follows, was described by the local branch of the Ecclesiological Society as “…a hideous and unnecessary aftergrowth… so substantial a deformity….” and was duly rebuilt in the proper style. It can be fairly said that the Ecclesiologists won the argument at the time, and as ever, the history of the period was written by the winners, so the views of their opponents get little coverage. Tastes change however, and the work of those who favoured an evolutionary approach to church architecture is once again beginning to be appreciated.
One of these was the Rev. John Louis Petit (1801-1868), a talented watercolourist, who painted hundreds of pictures of churches in Britain and around Europe that were used to illustrate the talks that he gave to large audiences. His paintings were never sold commercially and have only recently begun to be discovered and publicly exhibited by the Petit Society. The website of the Society (http://revpetit.com) gives a huge amount of detail about the development of his quite unique style that somehow captures the emotional impact of the church buildings he drew.
From a Black Country point of view however, John Louis Petit and his family are also of interest in two ways. First of all the Petit family derived much of their considerable wealth from the Ettingshall Park Estate in Sedgley, where one of them was responsible for the building of the folly we know as Sedgley Beacon. Secondly, John Louis also painted a small number of Black Country industrial scenes which show very early, and accurate, representations of the iron and coal industry. We consider both these aspects in what follows. First however we give a brief history of the Petit family.
The Petit family
The first of the Petit family to arrive in England was Lewis Petit (1665-1720), a member of the ancient Norman family of Petit des Etans, who, with many other Hugenots, fled to England from Caen on the revocation of the Edict of Nantes in 1685. He served in the British army as an engineer, rose to the rank of brigadier-general and was appointed lieutenant-governor of Minorca from 1708 to 1713. One of his two sons, John Peter Petit, married Sarah, daughter of John Hayes of Wolverhampton, the owner of the Ettingshall Park Estate near Sedgley. John Hayes died in 1736, and left Ettingshall to his son, another John Hayes. This John himself died in 1745 and the estate went to Sarah and her sister, and thus ultimately to John Peter Petit. Ettingshall Park was a large, originally arable estate, that even at that stage was beginning to be exploited for its coal and ironstone reserves. It is from that estate that much of the Petit wealth derived.
John Peter and Sarah’s only son, John Lewis Petit (1736-1780) qualified as a doctor in 1767 and was physician to St. George’s Hospital from 1770 to 1774, and to St. Bartholomew’s from 1774 until his death. He and his wife Katherine had three sons John Hayes Petit (1771-1822), Peter Hayes Petit (1773-1809) and Louis Hayes Petit (1774-1849), but clearly lacked imagination in the giving of names. Peter was a lieutenant-colonel of the 35th Foot and died of a wound received at Flushing in Holland during the Napoleonic war. Louis became a barrister and, from 1827 to 1832, was MP for Ripon. After ceasing to be an MP, his remaining years were largely devoted to literary and philanthropic pursuits. There is a striking monument to him in St. Michael’s church in Lichfield.

The monument to Louis Hayes Petit in St. Michael’s church in Lichfield
The eldest of the three brothers, John Hayes Petit (1771-1822) inherited the Ettingshall Park estate, but also followed an ecclesiastical career. He was ordained priest in Chester in 1798 and served a curacy at Ashton under Lyme near Stalybridge in Cheshire. During his time there he married Harriet Astley of the nearby town of Dukinfield. Harriet was born in 1779 to the painter John Astley (1724-1787) and his third wife Mary Wagstaffe (1760-1832). John Astley had a colourful life, painting portraits of many 18th century notables, arousing strong passions of admiration (mainly in women) or distaste (mainly in men). His first wife was an unknown Irish lady who died in 1749. The second was Penelope Dukinfield Daniel (1722–1762) widow of Sir William Dukinfield Daniel, 3rd baronet, and a daughter of Henry Vernon, former High Sheriff of Staffordshire. John and Penelope were married with some rapidity after she intimated that the original of the portrait he was painting of her would be available if he wished. On Penelope’s death, and the death of his stepdaughter, Astley inherited the substantial Dukinfield and Daniel estates in Cheshire and Staffordshire and was able to lead a life of some luxury and idleness thereafter. Harriett was one of three sisters, known as the Manchester beauties, and her marriage to John Hayes Petit would have brought him both a beautiful wife and a substantial supplement to his already considerable income.
In 1811 John was appointed Curate of Donnington, and then in February of that year he was also appointed as a Perpetual Curate at Shareshill, to the north-east of Wolverhampton. As well as the Ettingshall estate, he also owned considerable areas of land in Wolverhampton and south Staffordshire. Around 1817 he leased Coton Hall at Alveley in Shropshire, which was a very substantial property that belonged to the Lee family (from whom the US Confederate General Robert E Lee was descended). It would not have been a cheap place to lease. After John Hayes Petit’s death in 1822, Coton Hall was bought by James Foster (1786 -1853), the very successful and wealthy ironmaster and coalmaster of Stourbridge.

John Louis Petit
John Louis Petit, the artist, born in 1802, was the eldest of John and Harriet’s nine children. He inherited the Ettingshall estate on the death of his father in 1822, and also inherited the bulk of the estate of his uncle Louis Hayes Petit when the latter died in 1849. In total they formed a very substantial estate in the Wolverhampton area, that was being heavily exploited for coal, iron ore and limestone. He and his sisters also had a less tangible inheritance from his mother and his grandfather – the passion and the ability for painting and sketching. After he graduated from Trinity College in Cambridge in 1825, John Louis Petit firstly pursued an ecclesiastical career being curate at St Michael’s in Lichfield from 1825 to 1828, and then curate at Bradfield and Mistley in Essex from 1828 to 1834. He married Louisa Reid, the daughter of George Reid of Trelawny in Jamaica in 1828. The Reid family derived much of their wealth from slave plantations in Jamaica and the family received considerable compensation for their lost income when slavery was abolished in the 1830s. He gave up his post in Essex in 1834 and from the mid-1830s onwards he devoted his time to his painting and architectural criticism, and his story is well told on the website of the Petit Society. He died in 1868 and is buried with a number of his relatives, in a large tomb in St. Michael’s churchyard, where a display board has recently been placed outlining his career.

The grave of John Louis Petit and his family in St. Michael’s churchyard
The Ettingshall Park Estate
The extent of the lands owned by Join Louis Petit in Ettingshall in the 1840s are shown on the map below. The estate boundaries are taken from the Tithe Allocations and are superimposed upon the 1882 Ordnance Survey map of the area. The estate was in the north of Sedgley parish, just south of the Wolverhampton boundary and the holding was 413 acres in total. It is centred on Ettingshall Park farm and lies west of another large estate – that of Ettingshall Hall. A small block at the south of the estate was owned by his uncle and former MP, Louis Hayes Petit until his death in 1849. Most of the land, even at that stage was arable or pasture. There were a small number of collieries to the north-west, and two lime workings at Round Hill and Beacon Hill. However just beyond the estate heavy industry was beginning to encroach, with the Spring Vale Ironworks to the north-east and the Parkfields iron works to the north. The former was served by basins from the Birmingham Canal (as indeed were most ironworks in the area). The underlying 1882 Ordnance Survey map shows a similar situation in the south of the estates, with most of the field boundaries being identical to those on the tithe map, but in the north mining activities have completely eliminated the fields (and indeed makes the estate boundary difficult to determine) and indeed many of the roads shown on the tithe map. In effect the area of mining in the 1880s came right to the edge of the South Staffordshire Coal Field.

The Ettingshall Park estate. (The lands owned by John Louis Petit in the 1840s are outlined in red, and those owned by Louis Hayes Petit in green. Black triangles – collieries; red triangles – ironstone pits; green triangles – lime works; purple squares – iron works; blue circle – Sedgley Beacon
Although John Louis owned the land, he leased it to others. The central area around Ettinghsall Park Farm was leased to Dudley Fereday, with smaller agricultural plots leased to Edwin Dixon, William Fletcher and Edward Jay. The mines and pits were operated by George Jones, John Neve and Co., or the Parkfields Company who operated the nearby ironworks. Essentially we see here, as in so many places in the western Black Country at this time, the transition from a farming to an industrialised way of life.
As noted above Louis Hayes Petit owned some land to the south of the Ettingshall estate. This encompassed the highest point in the locality at Beacon Hill. It was on this hill in 1846 that the Beacon Tower was erected, which still stands if in a somewhat dilapidated state. The Sedgley Local History society attributes the building of this tower to “a local landowner, Mt Petit”, although it might have been used for astronomical observations by Lord Wrottesley a well-known Staffordshire amateur astronomer. Whether this was John Louis or Louis Hayes is not clear, but perhaps we have here the architectural critic dabbling in architecture himself, if only in the construction of what can probably fairly be described as a folly.

Sedgley Beacon (from the Sedgley Local History Society website)
The Black Country pictures
Most of John Louis Petit’s artistic work was directed at painting churches for use in his talks and arguments with the Ecclesiologists. However, he also painted a small number of scenes of Black Country industrial activity during his career, and these will be discussed in what follows. All are reproduced with permission of the Petit Society. I do not consider their artistic merits – indeed I would be quite incapable of doing so – but rather I will discuss the scenes the paintings portray and the locations from which they might have been painted. Three of these come from the early 1830s and one from the 1850s.

Spring Vale iron works from the Penn brook (?), early 1830s
The first shows an ironworks in the distance, framed by a much more rural location. My best guess for this is that it is a representation of the Spring Vale Iron Works, or perhaps the nearby Parkfield works, seen from the western side of the Ettingshall estate at a location on the headwaters of the Penn brook (which leads into the Wom brook, and then into the Smestow). Little detail of the works can be seen although the furnaces and chimney can be seen. The painting is of interest as showing the juxtaposition of rural and industrial elements.

Mines near Wolverhampton (?) c1830-35
The second painting is again dated in the early 1830s. The main feature is the pair of pits showing the scaffoldings of the “Rattle Chain”. This is a very early representation of such mechanisms. The nature of the structure between the scaffoldings is not clear but could perhaps be some sort of furnace or processing plant. The grim reality of the destruction of the surrounding countryside by spoil from the mines is also very apparent in the foreground. The figures of two mine workers wearing brimmed hats can also be seen. Nothing by way of safety equipment was provided and there were many injuries and deaths, which were simply regarded as part of the costs of the operation.
In the background there are two churches shown, one with a tower and one with a spire. At first sight they would seem to show the Wolverhampton churches of St. Peter’s to the left with the tower, and St. John’s to the right with the spire. The former was a favourite subject of Petit. However, this placing of the churches suggest that the scene was painted from the west of Wolverhampton, as St. Peter’s is to the north of St. John’s. This however is not possible, as there were simply no mines in this region – indeed the boundary of the south Staffordshire coal field is to the east of the town. We are left with two possibilities – either the artist added the church towers to a scene painted from elsewhere to contrast the old and the new (which of course as a painter he was perfectly at liberty to do), or the painting depicts a scene from elsewhere. In terms of other locations, I can find only one other location in the vicinity from which a church tower and spire could be observed – somewhere to the west of Dudley where St. Edmund’s and St. Thomas’s churches are so aligned. This would give a location for the pits somewhere in the Gornal area, which would be quite possible, being close to the Ettingshall Park estate. However, if this were the location, one would have expected Petit to have skewed the scene slightly to show Dudley Castle, which would be just off the left of the current picture. There may however be alternative possibilities that I have not identified in the Wolverhampton area. Reader’s thoughts would be very welcome.

Iron works in the Bilston area, early 1830s
The third picture shows an ironworks with four furnaces. The position of the two churches in the background, the one with the spire and the one without, again matches St Peter’s and St John’s in Wolverhampton and their relative position suggest that the picture was painted from the south-east in the Bilston area. The level of details it shows is remarkable. The furnaces themselves can be clearly seen, together with quite detailed depictions of ancillary buildings in the foreground. It would be interesting to know the function of these buildings. There are perhaps impressionistic indications of tram tracks and a canal basin in the right foreground, although this is very conjectural.

Springvale Ironworks, Bilston
This final picture is believed to have been painted in 1852 or 1853 and to depict the Springvale Ironworks at Bilston to the south east of Wolverhampton. It clearly shows a number of blast furnaces and other industrial buildings. In the foreground there is the depiction of a small housing settlement. The land here is greener than in the Wolverhampton painting, but still broken, looking as if it had been used for some extraction activity. The horses walking along the foreground track again give the contract between the old and the new. In the background we can see the chimneys of the Black County and perhaps, just to the left of the furnaces, a depiction of a church tower. The position from which the picture is painted can be more precisely defined from a consideration of the Tithe Map as somewhere in the vicinity of the junction of the current Parkfield Road with the Dudley / Wolverhampton Road. The painting position sits just outside John Louis Petit’s Ettingshall estate, and one can conjecture that the picture was painted on a trip to the estate to conduct whatever estate business was required with his agent and tenants.
One of the many things that intrigue me about the work of Petit is its breadth that ranges from the type of scene in these pictures to his more usual output of sometimes quite idyllic churches. I wonder if he saw, in the size and functional architecture of blast furnaces, the same grandeur that he perceived in many of the churches that he drew, an, in his mind at least, the stark differences between churches and blast furnaces were not as significant as the similarities. This is to some degree borne out by a quote from him made at an Architectural Exhibition – On Utilitarianism in 1856 at which the picture of Spring Vale Iron Works was probably exhibited.
“Usefulness and economy may not only be consistent with artistic excellence, but actually tend to the development of much that is grand and beautiful. If picturesqueness is a merit, I can answer for it that the most picturesque objects I have seen are buildings of the most strictly utilitarian character, without a speck of ornament, and you may be sure erected at no more cost than was deemed necessary, without the slightest attention whatever to appearance. I speak of the furnaces in the neighbourhood of Wolverhampton. Some of these taken as buildings independently of their accompaniments of fire and smoke, are absolutely grand. There is something, too, very impressive, to my mind, in the lines of modern fortification…’
This led to strong correspondence with Gilbert Scott who attacked him for admiring ‘railway sheds’ and factories!
Finally, for those interested in Petit’s primary work on church architecture, the book “Petit’s Tours of Old Staffordshire” by Philip Modiano is an excellent place to start. It is of course available on Amazon.
Since this article appeared in print in its uncorrected form, the author has been in correspondence with Ray Shill, who has written widely on the Black Country iron industry. The most important point to emerge from this correspondence has been the ambiguity around the name of Springvale ironworks and foundry. In the earliest references to these works the names Bilston, Coseley and Spring Vale ironworks and furnaces are used to refer to a variety of different works in the immediate area. So care is needed when considering any attribution of a name to one of the paintings shown above.
Lichfield’s first railway station?

In 2020 I published a blog post entitled “Lichfield Trent Valley 1847-1871” – a study of the “first” railway station in Lichfield that was built when the Trent Valley Line opened in September 1847, and shown in the engraving above. The figure below, reproduced from that post, shows the location of this station in relation to the station of the South Staffordshire Railway that crossed the Trent Valley line and the second (existing station). The underlying map is the 1848 Tithe map of the township of Streethay where the station is situated.

Extract from 1848 Tithe Map (red solid circle LNWR station location 1847-1871; red dotted circle – approximate SSR station location 1849-1871; green oval – location of current station
In 2021, I published a further post “Lichfield’s first station master” that looked at the life and times of William Durrad, the first to hold the position of Stationmaster. Both posts were gratifyingly quite widely read.
However a few days ago, I was browsing the 1851 census returns for Streethay (from which it might be concluded that I lead a rather sad existence). Sure enough, William Durrad and his family were there living at the railway station. But two pages earlier I came across the following entry.

Extract from the 1851 census for Streethay
It can be seen that it refers to Richard Mooney and his extensive family. Richard was a gatekeeper for the Trent Valley Railway and lived at the Old Station. Remember this was in 1851, when the railway had only been opened four years and, as far as anyone knows, the station that was built un 1847, the one shown above, was still in existence. What on earth was this “old station”? Looking at the order in which properties are listed on the census, the location of Richard Mooney’s dwelling can be quite precisely located, and is shown on the figure below, again on the 1848 tithe map. It can be seem to be where a road (the Old Burton Road) crosses the railway on a flat crossing – and thus the building shown is an ideal location for a Gatekeeper’s cottage. If this was a station, it was in use very briefly between the opening of the railway in September 1847 and the preparation of the tithe map sometime in 1848. Perhaps it was a temporary arrangement – simple platforms that were in use as the main station was being completed. It is also quite possible of course that the census entry is incorrect and based on erroneous information from Richard Mooney or the enumerator.

Extract from 1848 Tithe Map (red solid circle LNWR station location 1847-1871; red dotted circle – SSR station location 1849-1871; green oval – location of current station; purple circle – the location of the “old station”
So my initial post may not have been entirely accurate – it seems to me that there is a real possibility that there was, albeit for a very short time, an earlier station than the one I described in my earlier post. Sadly, there is nothing left of it on the ground. The crossing was replaced by a narrow bridge in the early 20th century, and this bridge was itself recently replaced by a much more substantial structure leading to the new cark park at the station. Any traces of the “old station” would have been destroyed when the foundations of the latter were being laid.
Measurements of Carbon Dioxide concentrations in a church
The measurements reported in this post were made by colleagues of the School of Engineering at the University of Birmingham – Dr David Soper and Dr Mike Jesson – whose help is gratefully acknowledged.
Introduction
Over the course of the Covid-19 pandemic, there has understandably been increased concern over ventilation within buildings and on buses and trains etc. This has been reflected in church circles where church ventilation has also been much discussed. Whilst more modern churches will have been specifically designed with ventilation in mind, with proper ventilation paths between windows and doors, the same cannot be said about older churches. For many such churches the only ventilation is offered by the opening of doors, and by leakage through windows and roofs. Because of the large vertical size of such buildings, this lack of ventilation is ameliorated by the ability of any pollutants of pathogens to diffuse throughout the large church space.
One such church is St. Michael on Greenhill in Lichfield (figure 1 below), which is essentially two large, connected boxes – a nave, and a chancel, with a main door in the north wall of the nave and a smaller door into the choir vestry on the south side, and internal doors between the vestry area, the nave and the chancel (figure 2). A though ventilation path is rarely established however as the external and internal doors are seldom open at the same time. There are plans to build new parish rooms to the south of the church, on the grassed area of the figure below.


This brief post outlines a short series of measurements to measure carbon dioxide (CO2) levels in St. Michael’s. CO2 is produced naturally by people during breathing and CO2 concentration levels are often taken to be an indication of pathogen levels when the population is infected. These measurements were made on Sunday May 15th 2022, when the service pattern was somewhat different from normal, with the normal 8.00 and 10.00 Holy Communion services supplemented by the Annual Parochial Church Meeting (APCM) at 11.15 and a 4.00 service at which a new Rector was Instituted by the Bishop and Archdeacon. As such it gave the opportunity to look at the effects of different congregation numbers (10 in the chancel for the 8.00 service, 50 for the 10.00 service and the APCM, and 150 for the Institution). A screen shot of a video of the Induction service is shown in figure 3 to give some idea of the density of the congregation.

The measurements
Carbon Dioxide measurements were made with small transducers and data loggers at different points around the church. These were attached to pillars of left on suitable window ledges. These sampled automatically every minute and the results were transmitted wirelessly to a Raspberry Pi computer and from there to a University of Birmingham web site from where the data could be accessed in real time. These measurements were supplemented by measurements of temperature and pressure using further transducers with built in data loggers.
For the sake of simplicity only the results from two of the CO2 sensors will be shown, as the results from them all were very similar. The location of these are shown on the plan of Figure 2 – one on a pillar in the nave, and one on a window ledge in the chancel. The photographs of the instruments shown in figure 4 indicate that they are quite small and discrete and indeed were barely noticed by the congregation. The results will be presented from midnight on Saturday May 14th to midnight on Sunday May 15th.


The results of the trials
The weather on May 15th was quite pleasant with early morning temperatures of 10°C rising to around 20°C in the late afternoon and evening. The external humidity varied from 20% to 100% throughout the day. Inside the church however there was far less variation with temperatures between 16 and 21°C and humidity between 55 and 70%. The was a light southerly wind in the morning, with a somewhat stronger easterly wind from mid-afternoon onwards.
The results of the CO2 measurements are shown on the graph of figure 5. These are shown in terms of parts per million (ppm) of carbon dioxide in the atmosphere by volume and are relative to a general background level of around 400 ppm.

The church was opened at around 7.30 am for the 8.00 Holy Communion service held in the chancel, which went on until till around 8.45. Around 10 people attended. There can be seen to be a small increase in CO2 levels in the chancel over the course of the service (A). Later in the morning there was a 10.00 Holy communion service in the nave with around 50 in the congregation, with a small choir of 4 or 5 in the chancel. This was followed immediately by the APCM from 11.15 to 11.45 in the nave with about the same number attending. During this period there can be seen to be a steady increase in CO2 levels both in the nave and the chancel (B). At 12.00 the church emptied and the doors were closed. This led to a steady decrease in concentrations (C) till about 2.00 when people started to arrive at the church to set up for the major service of the day – the Institution of the new Rector by the Bishop of Lichfield. At this point both the main door and the choir vestry door were opened (as Gazebos were being set up to the south of the church for refreshments after the service), and a ventilation path was opened through the church, with major CO2 concentration reductions (D). Around 3.00 the congregation for the 4.00 Induction service began to arrive and the church rapidly filled with around 150 attending, including a choir of around 20 in the chancel. There were significant increases in CO2 concentrations during the course off the service through till around 5.30 (E). When the service was over, both the main door and the choir vestry door were again opened, and there was a rapid drop in concentration levels till around 7.00 when the choir vestry door was closed (F). After some clearing up, the church emptied by around 8.00 and there was a gradual fall off in concentration levels (G).
Two main points emerge from these measurements. Firstly, and quite obviously, the levels of CO2 increase with the number of people in church and with the time they spend there – B and E on the above figure. Secondly it is clear that there are two different types of ventilation – the slow diffusion of CO2 throughout the building and leakage through the building envelope – roof, doors, windows etc. (C and G); and the rapid lowering of concentration levels when there is a direct ventilation path through the building between the two doors (D and F).
Now from the slope of the graph for the times when concentrations are falling, it is possible to get estimates of the time it takes for the concentrations to fall by 50%. For C and G these times are around 2.5 hours, whilst for D and F these times are between 10 and 30 minutes. Thus the through ventilation reduces the carbon dioxide levels much more quickly than simple diffusion and leakage.
Implications
The results show firstly that the method that was used is a simple and viable way of assessing the main ventilation parameters in a church. Colleagues from the University of Birmingham recognise that there is still work to on improving the frequency response of the sensors but overall the method has much promise. Secondly there are some implications for St. Michael’s itself – that large congregations in the church for lengthy periods of time can result in significant CO2 concentrations (and thus pathogens in times of infection), and that through ventilation is much more effective in reducing these concentrations than simply relying on diffusion and leakage. In the Parish Rooms developments that are under consideration for the area adjoining the choir vestry, it may be worth investigating if it is possible to design through ventilation paths through the church and the new development.
Train services on the Ffestiniog and Welsh Highland Railways

There are ongoing discussions, which at times are becoming quite heated, within the wider Ffestiniog / Welsh Highland Railway community about the nature of the services planned in this post pandemic period. On the one hand, the company sees the need to maximise train loadings and thus reduce the unit costs, to cope with huge increases in fuel and staff costs. This leads logically to the need to continue the successful pandemic style timetable of booked tours – from Porthmadoc to Tan–y-Bwlch / Blaenau Ffestiniog / Beddgelert / Caernarfon and back, with one train journey being filled before another is timetabled, and with no intermediate stops. The service pattern for late March 2022 shown above reflects this and consists of a number of named and themed trains. Without a doubt this meets the needs of most passengers, who are not necessarily railway enthusiasts, but simply want a good day our for them and their family, and is cost effective in that trains are maximally loaded. On the other hand, there is a strong, and as I perceive, growing, feeling amongst Ffestiniog and Welsh Highland Society members and supporters that a more normal scheduled timetable with intermediate stops should be reinstated, to restore the railways to what are perceived as their true selves as service providers. I have sympathy with both points of view – the financial challenges are certainly significant and need to be addressed, but the provision of specific tours simply does not meet the needs and aspiration of many. This includes myself, as I nearly always use the railway for journeys to intermediate stops, with walks of varying length between stations and “tours” hold no attraction at all for me. As things stand I, along with others, have no real reason to travel on the railways. As I write there are, I understand, proposals are being worked on to reinstate intermediate stops on some journeys, although it is not clear if this will approach anything like a regular service pattern.
The purpose of this post is to raise just one issue that is of potential significance. Last year I had the privilege of being an examiner for a University of Birmingham PhD thesis by Robin Coombs entitled “The sustainability of heritage railways”. I quote from the thesis abstract.
………In particular, the thesis explores the necessary condition(s) for the successful operation of a heritage railway in terms of governing their sustainability as expressed through consideration of their life cycle trajectory around the three pillars of sustainability – environmental, economic and social. The hypothesis proposed in the study is that good governance of railway assets and management is the key determinate of the sustainability of a heritage railway. This hypothesis was tested through a survey of 39 Directors and General Managers and 252 heritage railway enthusiasts of 104 heritage railways, semi-structured interviews with 15 Directors and General Managers, and the author’s recorded field observations and participation in 52 heritage railway visits and events. The research shows that the longevity of heritage railways does not simply arise from ‘good governance’ but is in fact the product of multiple interlinked variables and processes. Indeed, many heritage railways have survived and prospered despite poor governance, rather than because of ‘good governance’. One of the most significant of these explanatory variables is social capital, a hitherto under-researched governance variable in heritage railway studies. Through case study examples, social capital is demonstrated to have compensated and mitigated for failures of organisational governance and weaknesses in operational conditions on heritage railways. In this respect, heritage railways are argued to be similar to charitable and other public-good organisations. On this basis the hypothesis was rejected, and an alternative hypothesis proposed: that social capital (of which philanthropy, reciprocity and trust are key constituents) is a key determinant of the sustainability of heritage railways.
Robin makes a very strong case for the importance of what he calls social capital in the long-term sustainability of heritage railways – supporters contributing financially and materially and through voluntary activities. To my mind this is of very great importance in the current Ffestiniog and Welsh Highland context. A robust approach to income and expenditure through a business plan is certainly required in these financially constrained times, but if in doing so the relationship with volunteers and supporters is fractured, through the provision of a service pattern that does not meet their needs or their aspirations for the railways, this could potentially have a serious effect on the provision of social capital and thus on the long-term future of the railways, as supporters direct their time, efforts and money elsewhere. This simple fact should not be forgotten as future service provision is considered. I would thus suggest that conserving and expanding the social capital that the railways have built up over the decades is as important for the future of the railways as a financially robust business plan.

Robin’s thesis will in due course appear on the University of Birmingham’s ethesis web site at https://etheses.bham.ac.uk/ . In the meantime he can be heard describing his work in this podcast.